January 2000
Intermediate to advanced
672 pages
21h 46m
English
As you expect of an IDE, IDLE contains a built-in debugger. To use the debugger, it must first be enabled via the Debug → Debugger command from the Python shell window. The debugger dialog appears, and the shell window responds with:
[DEBUG ON]
>>>
IDLE is now ready to debug. To start the debugger, open the script to debug and run (or import) it. For the purposes of this example, let’s debug the same script you used for PythonWin (C:\Scripts\pywindemo.py in the example). Once the file is open, select Edit → Run script (or press Ctrl-F5). The debugger dialog becomes active, and the debugging session begins. Figure 4.7 shows you stopped inside your main function.
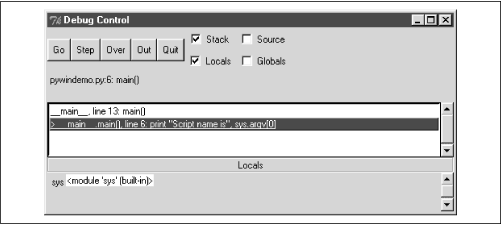 |
The stack leading to the current call is shown. Selecting an entry displays the local and global variables and the source code for the stack entry, depending on the options selected at the top of the dialog.
At the time of writing, there are a few limitations in the IDLE debugger worth mentioning:
When debugging the top-level of a module, the Go and Over commands function like the Step command. Go and Over don’t function correctly until the top-level script calls a function.
The Python shell window is effectively disabled during the debugging session. You can’t use normal Python commands to view and change variables while the debugger is active.
It’s quite possible that these and other limitations ...
Read now
Unlock full access


