8.1 Risk and Summary Measures
Remember the definition: Risk is the possibility of P&L different from expected or anticipated: variability in outcomes, uncertainty, or randomness. A distribution or density function is how we represent random possibilities, so the P&L distribution is the central focus for risk measurement.
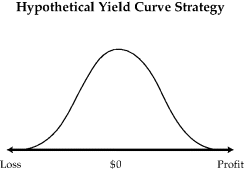
Figure 8.1 shows the distribution (technically the density function1) of P&L from a hypothetical bond strategy with many possible outcomes, some giving high profits, some large losses. The horizontal axis shows the P&L, ranging from large losses to the left up to large profits to the right. The vertical axis shows the probability of any particular P&L. The pattern shown, with approximate symmetry of gains and losses and with higher probability in the middle, occurs frequently in the financial markets.
Figure 8.1 Profit or Loss from Hypothetical Bond Strategy Based on Figure 5.1 from A Practical Guide to Risk Management, © 2011 by the Research Foundation of CFA Institute.

If we knew the full distribution of P&L, we would know most everything there is to know about the risk of the particular trade or portfolio. But it is rare that we will know or use the full distribution. We will usually be satisfied with some summary measure because the full distribution is too complicated to easily grasp or we simply want a convenient way to summarize the distribution.
Summary ...
Get Quantitative Risk Management: A Practical Guide to Financial Risk, + Website now with the O’Reilly learning platform.
O’Reilly members experience books, live events, courses curated by job role, and more from O’Reilly and nearly 200 top publishers.

