8.4 Techniques and Tools for Tail Events
The most difficult and vexing problem in quantitative risk measurement is trying to quantify tail or extreme events.
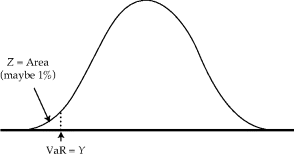
Tail events are important because large losses are particularly significant and VaR is often used to quantify the likelihood of large losses. The probability level Z is chosen low, say 1 percent or 0.1 percent, to produce a low probability that losses will be worse than the VaR and a high probability that they will be better. Figure 8.8 shows how a low level for Z implies that the VaR measures the left-hand tail of the distribution. Using VaR in this manner requires focusing on the tail of the distribution.
Figure 8.8 VaR for Low Probability Level Z Reproduced from Figure 5.9 of A Practical Guide to Risk Management, © 2011 by the Research Foundation of CFA Institute.

Jorion (2007) has a discussion of copulas in Section 8.3, alternate parametric distributions in Section 4.2.6, and an introduction to extreme value theory in Section 5.4; Marrison (2002, 157 ff) discusses some alternative approaches for tail events; Beirlant, Schoutens, and Segers (2005) discuss extreme value theory; McNeil (1999) has an introduction to extreme value theory in risk management, and Embrechts, Klüppelberg, and Mikosch (2003) wrote a text devoted to extreme value theory. McNeil, Frey, and Embrechts (2005) provide excellent coverage of many of the ...
Get Quantitative Risk Management: A Practical Guide to Financial Risk, + Website now with the O’Reilly learning platform.
O’Reilly members experience books, live events, courses curated by job role, and more from O’Reilly and nearly 200 top publishers.

