Let’s take a quick tour of some real-world examples of computer-based instrumentation applications. Please bear in mind that these examples are intended to show what one can do with automated instrumentation, not as specific, detailed examples of how to do something. In later chapters we will get into the specifics of interfaces, control protocols, and software algorithms.
In an electronics laboratory, or even a well-equipped hobbyist’s workshop, it wouldn’t be unusual to encounter oscilloscopes, logic analyzers, frequency meters, signal generators, and other such devices. While these are useful devices in their own right, when incorporated into an automated system they can become even more useful.
In order to use a piece of test equipment in an automated setup, there must be some type of control or acquisition interface available. Many modern instruments incorporate USB, Ethernet, GPIB, RS-232, or a combination of these (these interfaces are examined in Chapters 7 and 11). In some cases, they are standard features; in other cases, the functionality must be ordered as a separate option when the instrument is purchased.
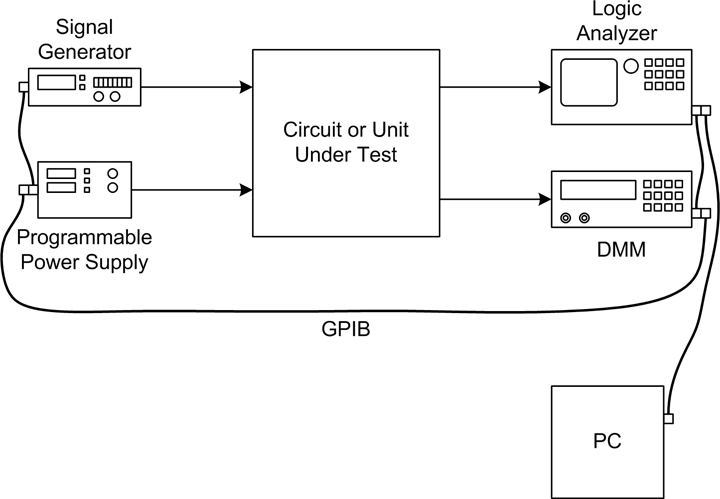
Figure 1-9 shows a simple arrangement for driving a device (the unit under test, or UUT) with a signal while controlling its DC power source, and acquiring measurement data in the form of logic analyzer traces and digital multimeter (DMM) readings.
The simple setup shown in Figure 1-9 has one instrument connected as a primary stimulus input to the UUT: namely, the signal generator. The signal it generates has a programmable shape (waveform) and rate (frequency). The signal level (amplitude) can also be controlled by the PC. There are two instruments connected to outputs from the UUT to capture digital logic signals (the logic analyzer) and one or more voltages (the DMM). A programmable power supply rounds out the instruments by providing a computer-controlled source of power to the UUT.
In this example, the various instruments are connected to the PC using a General Purpose Interface Bus (GPIB, also referred to as IEEE-488). There are various GPIB interface components available, ranging from plug-in PCI cards to external USB-to-GPIB adapters. Later in this book, we’ll examine some of these and look at various ways to write software for them in order to control instruments and collect data.
But what does it do? What Figure 1-9 shows could well be a performance characterization setup. If the UUT generates a pattern of digital signals in response to an input from the signal generator, this test arrangement will capture that behavior. It will also capture how the UUT’s behavior might change as the output from the programmable power supply is changed, or how some internal voltage might change as the frequency of the input from the signal generator changes. All of this data can be displayed on the PC’s monitor and captured to disk for storage and possible analysis at a later time.
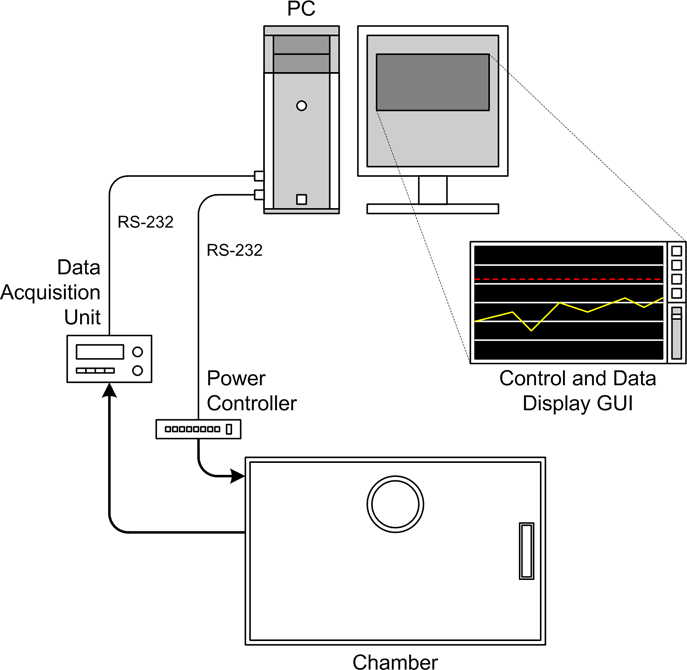
A research laboratory might contain pH meters, temperature sensors, precision ovens, tunable lasers, and vacuum pumps (for starters). Figure 1-10 shows an example of an instrumentation system for controlling an environmental chamber.
For our purposes, it’s not really important what the chamber is used for (it could be used for microbe cultures, or perhaps for epoxy curing). What is important are the instruments connected to it and how they, in turn, are interfaced to the computer. Whereas in the previous example the instrument interface was implemented using GPIB, here we have plain old vanilla serial connections in the form of RS-232 interfaces.
The data acquisition instrument is responsible for sensing and converting analog signals such as temperature, and perhaps humidity. It might also monitor the electrical status of any heaters or coolers attached to the chamber. The power controller instrument is responsible for any heaters, coolers, cryogenic valves, or other controlled functions in the chamber.
The primary objective of a setup such as this would probably be to maintain a specific temperature over time within some predefined range. It might also incorporate temperature ramp-up and ramp-down characteristics, depending on what exactly it is being used for. Generally, nothing in a system like this happens on a short time scale; significant changes may take anywhere from minutes to hours.
If implemented as a bang-bang controller, a type of on-off non-linear controller that we will look at in detail later on, there won’t be any need to vary the amount of power applied to the heaters or the cooling system. It operates much like the thermostat in a house. The instrumentation can utilize the rather slow RS-232 interfaces because there is no need to run the controller with a small time constant (i.e, a fast acquisition rate).
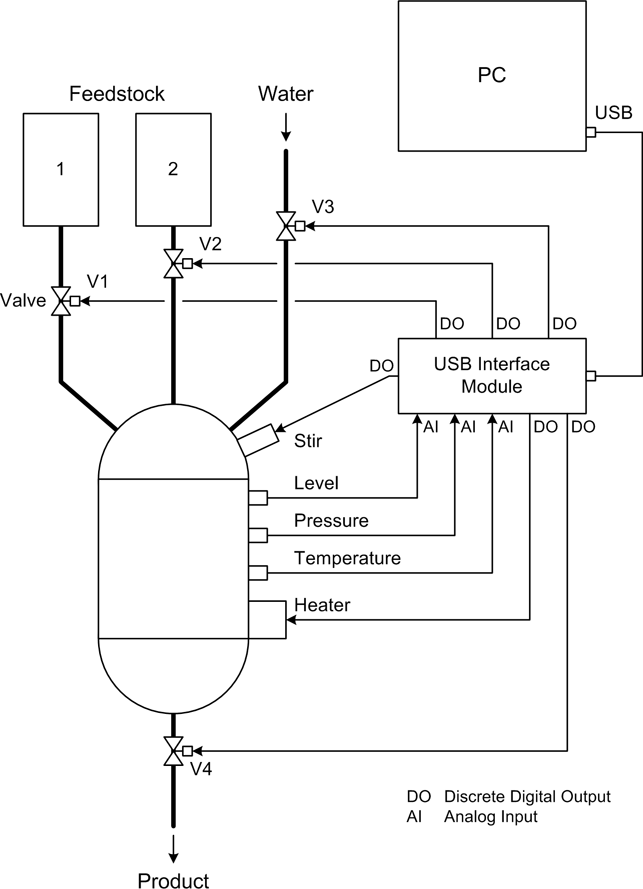
The diagram in Figure 1-11 is a representation of a simple automated process control system. This system might be intended for producing artificial maple syrup, or it could be some other kind of controlled chemical reaction to produce a specific output product. Note that the diagram is somewhat nonstandard, mainly because its intent is to illustrate without getting wrapped up in the details of standardized process control symbology.
In Figure 1-11, we see yet another type of interface—the USB interface module. These are common and relatively inexpensive. You can even buy one as a kit if you feel inclined to build it yourself. Many provide a set of discrete inputs and outputs, some analog inputs with 10- or 12-bit conversion, and perhaps even some analog outputs or a pulse-width modulation (PWM) channel or two.
There are four valves in the diagram shown in Figure 1-11, labeled V1 through V4, each of which is connected to one of the discrete outputs from the USB interface module. A heater is also connected to a discrete output. Note that the diagram does not show any circuitry that might be necessary to convert the 5-volt discrete signal from the USB controller into something with enough current and/or voltage to drive the valves or the heater. We’ll examine how to drive external devices that utilize high currents or high voltages (or both) in Chapter 2. Three analog inputs are used to acquire liquid level, temperature, and pressure data from sensors.
As with the previous example, this probably would not be a high-speed system. It would most likely perform just fine if the sensors were read and the controls (valves and heater) updated every 1 to 5 seconds.
Get Real World Instrumentation with Python now with the O’Reilly learning platform.
O’Reilly members experience books, live events, courses curated by job role, and more from O’Reilly and nearly 200 top publishers.


