Chapter 9. Debugging and the Trace Facility
Overview
Where scripting languages really shine is in the fast, easy program development they make possible. Their interpretive nature leads to built-in tools that make debugging much easier.
Rexx offers tremendous power in its tracing facility. Implemented by its trace instruction, the trace built-in function, and a variety of supporting functions and features, the tracing facility enables you to quickly and easily step through your code as it executes. Rexx will display the results of expression evaluation, variable contents, lines of code as they are translated and run, program position ... indeed, almost anything going on in the script. You can single-step through your code, allowing Rexx to pause before or after each line of the source code. You can execute Rexx statements while your script is paused, for example, to inspect or alter the values of variables. At anytime, you can easily turn tracing on, off or to some different level of granularity. The trace facility makes debugging even the most complex logic a simple affair. This chapter describes the trace facility and how to use it in detail.
The say Instruction
Figure 9-1 shows three basic approaches to debugging Rexx scripts.
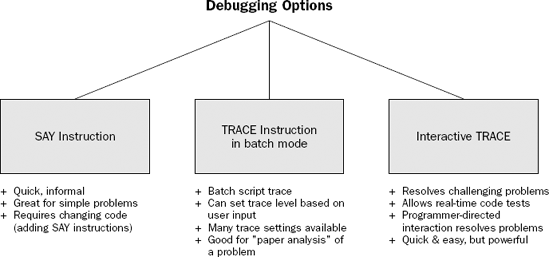
Figure 9-1. Figure 9-1
Let's start with the most basic approach to debugging. This simple technique temporarily adds extra say statements to the code to display ...
Get Rexx Programmer's Reference now with the O’Reilly learning platform.
O’Reilly members experience books, live events, courses curated by job role, and more from O’Reilly and nearly 200 top publishers.

