Chapter 4. Logging and Monitoring
Even though Automatoonz has gone through the process of securing its infrastructure, as you saw in the previous chapter, malicious actors will still try to infiltrate its environments. There are different layers to a website, and gaining visibility and awareness in all of them can be complicated. How can they add more safeguards?
In this chapter, we’re going to review different threats and attack styles. We’ll also look at how proper logging and monitoring techniques can help to implement a Defense in Depth strategy, in which multiple or additional security layers are applied to protect an organization and its assets from security vulnerabilities. We’ll show you some security tools to protect your organization’s endpoints, data, applications, and networks; to stop cyber threats before they happen; and to slow or minimize additional damage in affected areas. Amazon’s CloudWatch service, for example, simplifies the collection of operational data and monitoring in the form of logs, metrics, events, and dashboards.
What Are Logging and Monitoring—and Why Do They Matter?
First, let’s clarify some terms. Logging and monitoring are often confused. Logging is the act of capturing the information the system or application outputs, while monitoring is the act of using the logs to track meaningful events. Metrics are specific benchmark measures used to evaluate performance and are an important part of monitoring. Dashboards are interfaces that allow users to see everything they are monitoring in one place.
Why do logging and monitoring matter? Logging and monitoring play key roles in any cloud native security strategy. In fact, they are critical to mitigating any gaps in your network’s security visibility (a strategy for using logs to enhance your understanding of the security environment).
Observability is the process of evaluating the state of a system by using logs, metrics, and traces. It is a proactive step in detecting vulnerabilities in your system before an attack. You need to be able to observe what’s going on in your system and to correlate events and modifications with users. This way, you can spot unknown or anomalous patterns of activity and investigate them before an attack brings down the system.
For example, one metric might be an aggregate where you factor in the event, resource attributes, and timespan. When you take the information in an event and break down the contexts, you’ll find that unique static and dynamic relationships start to take shape, and you can standardize on common data structures. This might include using JSON for extracting raw text from records, developing a standard schema for your fields, or using standard libraries, like the Logging module for Python. Avoid logging cryptic or nondescriptive messages that people will have a hard time understanding. Keep logs simple and concise to make them easier to parse.
Meaningful correlations in your data structures can reduce your mean time to restore (the time it takes to recover from a product or system failure) by removing the need to dig through multiple relevant log types across systems and connect alerts with events. Coming up with those meaningful correlations gives you the opportunity to evaluate which events and attributes are just noise and which can provide insights into decoupled activities in the environment.
Filtering the streams of information found in logs is equally valuable, and also difficult without the proper mechanisms in place that logging and monitoring features offer. Understanding different attacks that can be used is critical in identifying patterns that emerge.
Attack Styles
The style of an attack will depend on the attacker’s goals and whether they are playing the “long game” or not. For instance, ransomware programs automatically spread through infected networks, which is a direct short-term attack. But ransomware has been evolving into different types. In human-operated ransomware attacks, the attackers gather as much information as possible about their target, often waiting months before launching an attack. Sophisticated attacks like this can cause key industries and infrastructure, like oil pipelines and healthcare, to halt operations for hours or even weeks.
Advanced Persistent Threat Attacks
The evolution in ransomware (although morally bankrupt) has led to an increase in extortion ransomware and ransomware as a service (RaaS). These are known as advanced persistent threat (APT) attacks. Here are some broad classifications:
- Crypto-ransomware
- Allows attackers to access devices and encrypt all of the data or objects, rendering them useless without the decryption key from the attacker. Crypto-ransomware confronts users with a screen demanding payment that includes a counter or deadline. If the victim doesn’t pay by the deadline, the encrypted data is permanently deleted.
- Leakware or doxware
- Threatens to release confidential or sensitive data if the ransom is not paid in time. Typical targets include financial institutions and public companies.
- Locker ransomware
- Locks the victim out of their systems and limits their abilities; they can only interact with screens related to the ransom demands. This attack also restricts the functioning of peripherals, like keyboards and mice. Most of the time, locker ransomware doesn’t destroy data on the target system, but rather blocks the victim from accessing the data. Usually, a countdown or timer is displayed to pressure the victim to pay.
- Ransomware as a service (RaaS)
- Enables malicious actors with little or no technical knowledge or programming skill to subscribe to a SaaS-like business model in order to deploy a ransomware attack. The RaaS provider takes a percentage of the ransom in payment for providing the service.
- Man-in-the-middle (MitM)
- Secretly relays (and possibly modifies) communications between two legitimate parties to an illegitimate third party inserted between them. The two unsuspecting legitimate parties believe they are communicating with each other directly. This is a form of eavesdropping that involves intercepting information and data from both parties while also sending malicious links or other information to both legitimate participants, potentially allowing the attacker to impersonate one of the parties to gain access to their systems.
- Privilege escalation
- Elevates the attacker’s access at the application, database, or even operating system level. For example, if a security compromise occurred where a bad actor elevated their privilege to remove a key component of a service, this could cause major disruption to that service.
We’ll discuss APT attacks more in Chapter 6.
Ransomware Strains
Now, let’s look at a few examples of specific ransomware strains:
- CryptoLocker
- In this locker ransomware strain, the malicious attacker encrypts the victim’s data. The victim has to pay for the private key to decrypt their data in order to regain access. Payment is generally demanded in the form of Bitcoin or prepaid vouchers, to reduce traceability. If the victim misses the deadline, the ransomware deletes the private key, permanently denying access to the encrypted data. CryptoLocker targets Microsoft operating systems and is delivered via an email attachment.
- Bad Rabbit
- In this strain, the victim’s system file tables are encrypted. Its code contains string values consisting of character names from the TV series Game of Thrones. The payment demand is in the form of Bitcoin. It targets Microsoft operating systems and uses compromised websites to spread a fake Adobe Flash update as the delivery method.
- Cerber
- This RaaS attack targets cloud-based Microsoft 365 users. A password-protected, zipped .DOT file is hidden in malicious ads or suspicious emails. It contains a macro or Windows Script File that infects the victim’s local host. The payment demand is in the form of Bitcoin.
Passive and Active Attacks
Passive attackers typically attempt to access sensitive or business-critical data through any endpoints or applications authenticated to the target organization’s network. They infect the endpoints with malware, leaving the data intact. The attacker discreetly monitors the victim’s system and network by analyzing transfer rates and connectivity levels, scanning for open ports, recording ingress and egress traffic, and collecting information from communication channels in the victim’s environment. The attacker uses that information to identify vulnerabilities they can exploit to plan and perform attacks.
For example, a passive attacker might exploit an expired certificate on a security device. The 2017 Equifax data breach was conducted in this fashion; the attackers used a packet analyzer tool to monitor network traffic. It installed a keylogger and waited for users to enter their credentials, which it recorded for later use.
Active attackers gain unauthorized access and cause damage to a network’s performance. For instance, they can delete, modify, corrupt, de-encrypt, and re-encrypt data with different keys. Often, active attackers use a combination of attack types to layer on complexity with advanced persistent threats. Some examples of active attacks include:
- Code and SQL injection
- This attack is often used on websites to steal or destroy sensitive data from organizations or end users. SQL injection, or inserting SQL queries, is a technique where malicious SQL statements are inserted into input fields, leveraging the existing execution process in a SQL database. The attacker can modify the SQL to return additional results (hidden data). The query can subvert an application’s logic, retrieve data from multiple database tables (called union attacks), gather information about the version and schemas of the database (called database exploits), and perform queries that do not return in the application’s responses (called blind SQL injections).
- Distributed Denial of Service (DDoS)
- This attack attempts to affect or exhaust the resources available to legitimate users of a target’s website, network, application, or service. Internet of Things (IoT) botnets or devices can create a volumetric DDoS attack, using their traffic to overload a system’s network. The attack can compromise the application layer by starving backend resources, or encrypted traffic can cause floods on your networks, known as SSL DDoS attacks. As with ransomware, there’s also a market for DDoS as a service.
- Cross-site scripting (XSS)
- This attack injects or inserts malicious client-side code into the code of a trusted application or website. The attacker sends malicious links in hopes that the victim will open them, allowing the attacker’s code to run on the victim’s local system. The attacker can then steal the victim’s active session cookie or session token. This compromises account access, since the attacker can impersonate the victim. The injected code can record keystrokes, redirect users to unintended websites, and expose sensitive site-specific information. Web browser–based exploits can also disrupt the user experience by crashing the browser.
- Unauthorized access
- This attack can occur any time an external or internal actor gains access without authorization to data, networks, endpoints, applications, systems, or devices.
This isn’t a complete list, but it should give you an idea of the breadth of the potential attacks you need to prepare for. Next, we’ll look more closely at log types and logging, which can detect not only security breaches and attacks, but also operational issues.
Log Types
Infrastructure is the sum of multiple components, both physical and virtual: software, virtual machines, virtual servers, virtual networks, and so forth. The log files from these components are known as infrastructure logs. AWS provides software monitoring agents to capture infrastructure logs from systems, hardware devices, networks, and user activities. The logged information could contain timestamps for events in different standardized formats (depending on the configuration), universally unique identifiers (UUIDs), event sources and destinations, and additional data. People or machine-driven algorithms can analyze collected infrastructure logs. They can query or sort aggregates and view new relationships to detect operational issues, as well as to identify security breaches or malicious attacks by internal or external actors.
Application logs are composed of the data generated by software applications running on nodes, EC2 instances, or containers. Applications deployed on the infrastructure also constitute a potential attack plane on the presentation layer. The nature of these attacks is likely to differ based on the written codebase’s programming language (such as Python, Go, or Java), so that’s a good starting point for deciding which attacks your detection tools should look for.
Application logging can identify vulnerabilities that can be introduced in many ways: by legacy libraries in applications, data management, systemic issues, the development life cycle, and even proper testing, token, and certification rotation in the environment. For example, an attacker might extend the time range of a session ID that stores information about when an application’s authentication expires. This gives them time to explore the target environment, escalate access privileges, or even attempt to brute-force their way through weak patterns.
In addition to generating infrastructure and application logs, you can use tools for further analysis, including:
- Security information event management (SIEM) tools
- SIEM tools can further analyze and correlate logs to help identify any security compromises.
- Dashboard tools
- Dashboards use log data to create visuals, such as graphs and tables, that help people identify patterns or anomalies that could indicate a security compromise.
- Incident management tools
- Incident management tools allow support personnel to review the logs, triage problems during incidents, and actively resolve issues. In addition, these tools can archive logs and use them to perform root cause analysis.
As you can see, analyzing logs requires storing them safely. Let’s look at log storage next.
Log Storage
In the latest Amazon Linux images (as of fall 2022), the amazon-cloudwatch-agent package is available for installation. It will create a predefined JSON configuration file and user cwagent during installation. You can also access the console by running the following command:
> sudo /opt/aws/amazon-cloudwatch-agent/bin/amazon-cloudwatch-agent-config-wizard
The system will then prompt you for information and an AWS Systems Manager (SSM) document. There is an option to customize the CloudWatch agent username, proxy settings, and metrics by manually editing the configuration file (/opt/aws/amazon-cloudwatch-agent/bin/config.json) and reloading the latest changes:
> sudo /opt/aws/amazon-cloudwatch-agent/bin/amazon-cloudwatch-agent-ctl \
-a fetchconfig -m ec2 \
-c file:/opt/aws/amazon-cloudwatch-agent/bin/config.json -s
The last step is to develop an IAM role for the EC2 instance that has the CloudWatchAgentServerPolicy attached.
This allows infrastructure metrics to be extended to openldap, openvpn, packet filtering, syslog, and so forth. Application access and error logs can be sent to CloudWatch as individual log streams, based on the source.
Tip
The latest (as of this writing) CloudWatch agents support StatsD and collectd daemons and AWS OpenTelemetry. OpenTelemetry enables applications with OpenTelemetry metrics to integrate with CloudWatch. It is supported by CloudWatch Embedded Metric Format (EMF).
During the CloudWatch agent configuration, CloudWatch logs enable you to store all customer metrics from the previous 14 days for up to 15 months. By default, the service uses aging logic to roll up logs together for longer periods of storage. For example, data that is stored at 1-minute resolution will be rolled up into data points at 5-minute resolution after 15 days. That window will continue to increase, up to one hour after a set number of days, unless the logs are offloaded to different storage solutions (see Example 4-1).
Example 4-1. Code snippet from AWS SSM document to configure a CloudWatch agent using IaC
Resources:
 CloudWatchConfigParameter:
   DependsOn: EC2Instance
   Type: AWS::SSM::Parameter
   Properties:
     Name: AmazonCloudWatch-linux
     Type: String
     Value: !Sub |
       {
         "agent": {
           "metrics_collection_interval": 60,
           "run_as_user": "cwagent"
         },
         "logs": {
           "logs_collected": {
             "files": {
               "collect_list": [
                 {
                     "file_path": "/var/log/nginx/error.log",
                     "log_group_name": "DemoApp/error.log",
                     "log_stream_name": "{EC2Instance}"
                 },
                 {
                     "file_path": "/var/log/nginx/access.log",
                     "log_group_name": "DemoApp/access.log",
                     "log_stream_name": "{EC2Instance}"
                 }
               ]
             }
           }
         }
To preserve the original data resolution and to meet possible compliance requirements, you can store logs in different Amazon S3 bucket types, where CloudWatch log rollup does not automatically apply and manual rollup is required. You can define life cycle rules to automatically migrate Amazon S3 objects to S3 Standard-Infrequent Access (Standard-IA), Amazon S3 Glacier Instant Retrieval, Amazon S3 Glacier Flexible Retrieval, or Amazon S3 Glacier Deep Archive, based on the age or number of newer versions of the data. (For more information on Amazon S3, see the official AWS documentation.)
You can also set life cycle policies by bucket, prefix, object tags, or object size, allowing you to delete data at its end of life. The advantage of life cycle rules and policies is that they help reduce the cost of storage by either archiving the data to lower-cost storage or deleting data that is no longer needed.
Defining life cycle rules can be tedious and time-consuming, however. To avoid this, consider using Amazon S3 Intelligent-Tiering service (Figure 4-1). According to its documentation, this service “automatically moves objects that have not been accessed to lower-cost access tiers,” without operational overhead or data deletion. Then, you can enable versioning of sensitive or operation-critical logs to maintain their integrity and make it easier to recover from a disaster.
Figure 4-1 shows this workflow, with the following steps:
The EC2 instance is streaming log data to CloudWatch logs.
AWS Lambda is invoked when there is log data waiting to be written.
AWS Lambda pushes the logs into an S3 bucket for storage.
All logs are encrypted using S3 server-side encryption.
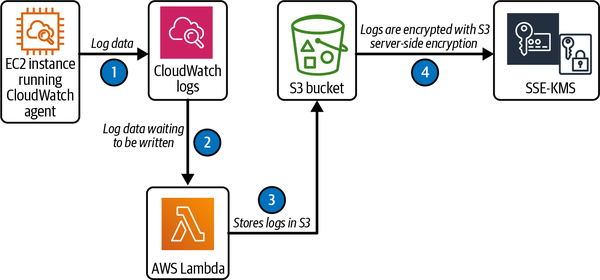
Figure 4-1. Storing CloudWatch logs from an EC2 instance in an S3 bucket
By default, CloudWatch logs use server-side encryption for the log data at rest.
Another option for encryption is AWS Key Management Service (KMS). Using a customer-managed KMS key, you can apply encryption at the log group level at the time of provisioning, or after the resource exists. The CloudWatch log decrypts the data upon request, but needs additional permissions for the customer-managed key in such cases. Amazon S3 server-side encryption using KMS (SSE-KMS) can be applied at the bucket level. S3 will only share an S3 bucket key for objects encrypted by the same KMS key. To configure an S3 bucket key for existing objects, you can use a COPY operation. This will reduce calls from S3 to KMS, in turn reducing traffic to these services.
Detecting Anomalies
You can transform the ingested data from CloudWatch logs into metric filters. Metric filters contain a set of key elements: default value, dimensions, filter pattern, metric name, and metric value. To create alarms and visual representations, you can turn the metric filters into numerical CloudWatch metrics. This is where you can make use of CloudWatch’s anomaly detection feature. Anomalies are data points that are irregular compared to the rest of the dataset, or deviations from some normal behavioral pattern in a given time frame.
Anomalies can happen anywhere; they’re not restricted to infrastructure and application logs. Say a malicious actor is attempting to gain access to your web application by scanning and brute-forcing passwords for usernames. If you don’t have anomaly detection enabled, you might not notice this intrusion, which could have dire consequences. Important customer data could be compromised. You could lose control of business-critical services, or an outage could take down the whole application, resulting in lost revenue and leaving your team scrambling to restore service.
Your monitoring automations should cover all available data streams, because bad actors leave no stone unturned. The benefits of investing in automated anomaly detection tools include:
Finding out about customer-facing issues before the customer experiences any service degradation or interruption
Reducing the time needed to identify the root cause of an anomaly
Reducing the need to correlate data from different sources manually
Gaining valuable insights into your operations, which can be used for improvement and future feature development
Proactive monitoring for security and regulatory compliance, without overloading operations staff with too many different dashboards to watch
Anomaly detection is sometimes included in compliance requirements. For example, some fintech companies are required by regulations to use anomaly detection with end-to-end synthetic transaction capabilities. This requirement allows them to generate and test different synthetic transaction scenarios to produce various anomaly situations. The synthetic transactions are simulating activity normally performed in an application or on a website by a real person.
Note
Metric math uses statistical techniques to detect and calculate behaviors in datasets. This helps data scientists teach machine learning algorithms to detect anomalies.
Anomaly detection tools use machine learning to perform versatile pattern matching, similar to regular expressions. The filter pattern element uses alphanumeric and nonalphanumeric characters, operators, and case sensitivity. For example, in an application’s web server access logs, you might create a metric filter called 4xxCount to extract individual log events, which produces metric values for all HTTP 4xx error codes. Gathering this metric data provides a means to identify HTTP 4xx error code patterns.
You can use metric filters in combination with CloudWatch alarms to monitor metrics, for example 4xxCount, and respond to changes (see Example 4-2). For example, you could set an alarm to alert you any time 4xxCount changes, shortening the time to discovery.
Example 4-2. Code snippet from file ch4_cloudwatchlog-alarm.yml to create a CloudWatch metric filter
CWLogMetricFilter:DependsOn:CWLogGroupType:AWS::Logs::MetricFilterProperties:FilterPattern:!RefLogFilterPatternLogGroupName:!RefCWLogGroupMetricTransformations:-MetricValue:!RefLogFilterMetricValueMetricNamespace:!RefLogFilterMetricNameMetricName:!RefLogFilterMetricName
In AWS CloudTrail, you can customize filters and alarms to watch billing trends and alert you when an unusual or excessive number of resources are provisioned or taken down in an account. This can help you detect issues such as forgotten resources, compromised user access, and overly permissioned roles in teams and organizations. Let’s look to Automatoonz for an example.
As you’ve seen in the previous chapters, Automatoonz has been deploying resources at breakneck speed. The development, security, and finance teams need to monitor multiple dimensions. Although funding has not been an issue, some managers (especially Linda) have been raising eyebrows at the consistently increasing costs of the AWS accounts. Linda asks Ravi, a DevSecOps engineer, to find out where the overspending is coming from.
Ravi logs into the AWS console and creates a Cost and Usage Report in CloudTrail. This shows him which resource types, regions, and tags have been accruing bills. Since Automatoonz works in a single US region, he decides to create alerts based on the tags and regions to track and alert the team when there is unauthorized activity across unapproved regions.
While reviewing the billing data, Ravi notices billing activities for resources in a US region that should be disabled, according to company policy. He knows it’s possible to disable a region and still have resources there that continue to incur charges. He checks to see if logging is enabled for that US region in CloudTrail (it isn’t) and if any logs are stored for it (there aren’t). Ravi shows the operations team his findings and asks for permission to access and explore these mysterious instances and the applications they’ve been running.
Upon investigating the should-be-disabled region, Ravi finds a small Discord setup mimicking a local SIP provider that offers international telephone service. This fraudulent setup has been attempting to record sessions and steal data. Ravi writes a root cause analysis (RCA) report with the details, and new engineer Jake works quickly to decommission the unauthorized resources. The security team follows up by using IaC to set monitoring alarms, dashboards, Config rules, and proper logging so that this won’t happen again.
CloudTrail is great for investigating API activity in an AWS account, but for a more granular view of your application’s behavior and events, CloudWatch can output custom information. CloudWatch’s anomaly detection feature can analyze past metric data for statistics and anomaly thresholds, then create a model of expected values. In the dashboard shown in Figure 4-2, you can visualize hourly, daily, and weekly patterns in the metric data. You can even perform calculations using math expressions with GetMetricData, then create new time series based on these metrics. This is useful for detecting APT attacks.

Figure 4-2. A CPU usage spike detected in a CloudWatch dashboard widget
We can see the following in Figure 4-2:
The line in the graph represents the normal data flow.
The envelope or band around the data is the configured or allowed threshold within which the normal data is expected to fluctuate.
The line outside the band represents the abnormal pattern detected in that time frame.
You can also detect anomalies with updates to dashboards, which serve as a visual aid to investigate events further.
As a best practice, when creating an anomaly detector, configure the following in Example 4-3:
Example 4-3. CloudWatch alarm with anomaly detection for a Java application’s memory (code snippet from file ch4_cloudwatchlog-alarm.yml)
CWAnomalyDetectorOnUsedMemory: Type: 'AWS::CloudWatch::AnomalyDetector' Properties: MetricName: !Ref AnomalyMetricNameNamespace: !Ref AnomalyNameSpace Stat: !Ref AnomalyStat Dimensions:
- Name: !Ref AnomalyDimName Value: !Ref AnomalyDimValue Configuration: MetricTimeZone: !Ref AnomalyConfigZone ExcludedTimeRanges: - StartTime: !Ref AnomalyConfigExcludeStart EndTime: !Ref AnomalyConfigExcludeEnd
CloudWatch metric to watch.
Dimension name and value. These fields are optional, but the value creates the threshold criteria for the anomaly detector to generate a CloudWatch alarm.
Understanding metric data and time series aggregations can be complex. It’s important to contextualize your information. If you make decisions with limited data or data from the wrong time bracket, you might make incorrect decisions. When in doubt, zoom out and look at the bigger picture, with bigger units of time. Let’s consider another example.
Since Automatoonz sells video games, there’s a seasonal flow to its site traffic that maps to the demographics of its customer base. For instance, in September, media entertainment traffic and sales tend to decrease because of school starting. The company also holds holiday-driven sale events. Thus, Automatoonz’s usage of EC2 instances ebbs and flows in patterns throughout the year. As the company gathers more historical data and sees patterns emerge, its anomaly detection efforts become more accurate.
When the AWS bill reflects a spike in usage, Ravi, the DevSecOps engineer, asks around. None of the dev team members have noticed a spike in the EC2 resource usage graphs. Ravi notices that they’re only looking at data from the past week, so he tries graphing the data over a period of weeks, then months. Now everyone can see the spike. It turns out that some of the developers have been leaving their EC2 instances on without using them.
Ravi shows his observations to Dave, the dev team lead, who promises to investigate how to improve the team’s resource management. The two of them agree to refine the IaC values in their monitoring to reduce notifications for false alerts or alarms. Because the code has been committed to a version-controlled repository, they can automate management of these configuration changes using a pipeline.
Remediation with AWS Config
AWS Config and CloudWatch also provide other managed services that can evaluate CloudFormation configurations, record changes over time, provide historical records for audits, and perform security analyses on AWS resources.
AWS Config, for instance, allows you to codify policy and guidelines for your environment and to receive notifications whenever a resource’s configuration drifts from the associated rules. It is a service you have to enable in your environment to record configurations, which can take some time to complete. For more information on AWS Config, see the official documentation.
If AWS Config detects noncompliant resources, it notifies you and provides programmatic auto-remediation actions to get them back into compliance, without you having to set up additional monitoring. AWS Config also evaluates your existing configuration against the latest policy changes, to keep the system up to date and minimize technical debt.
Tip
If AWS Config detects multiple resource dependencies that could cause errors, you can use it to preview direct and indirect relationships. For example, the relationship between an EC2 instance and a security group is a direct relationship, because security groups are returned as part of the “describe API” response for an EC2 instance. However, the relationship between a security group and EC2 is an indirect relationship, because EC2 instances are not returned as part of the “describe API” response for a security group.
Keep in mind that AWS Config has configuration records from your account’s entire history, which it can leverage to compare or troubleshoot resource issues. You can send the configuration history and snapshots to existing or new S3 buckets, depending on your organization’s policies for centralized logging. This gives you historical data that can help reduce the time to a solution or technical debt. You can also enable configuration changes and notifications to an existing or new Simple Notification Service (SNS) topic as a form of alert across accounts in the same region.
As the resources in your AWS account go through provision and depreciation cycles, you can use AWS Config rules to evaluate resources across the account, including:
These are part of a list of AWS Config managed rules, modeled after common best practices, that can be predefined or customized. The managed rules can be found under the Config service within the AWS console. To add custom AWS Config rules, you can develop them using Custom Config Rules or Custom Lambda Rules (programming languages supported by AWS Lambda), then add them to AWS Config.
There are three types of actions that can invoke an AWS Config rule: making a change in the AWS resource, changing the schedule, and invoking a rule through the console. There are two kinds of remediation actions associated with invoking an AWS Config rule: manual (not recommended) and automatic (recommended). A remediation action is invoked by an AWS Systems Manager API and a configuration file that contains the details of the tasks to perform to return to compliant status. Let’s look at the two kinds:
- Manual remediation
- A manual remediation action might be something like a person updating a noncritical software package (say, updating bash from version 3.0 to version 5.1.16) in waves across EC2 instances to be compliant with Linux nodes.
- Automatic remediation
- Automatic remediation actions happen when an AWS Config rule evaluates the state of a resource and finds it to be noncompliant. If auto-remediation is enabled, AWS Config invokes the SSM APIs to run the SSM configuration file. For example, you could enable S3 bucket encryption with the preconfigured SSM configuration file AWS-EnableS3BucketEncryption, or develop your own configuration file in JSON or YAML format for custom operations to start existing workflows. To streamline processes, this might mean invoking a notification via email or webhook to create a ticket in your IT service management tool.
AWS Config rule evaluations will run based on tags associated with the resources. A good tagging system can reduce unnecessary noise and streamline processes. Chapter 5 will discuss tagging in more detail.
Over time, AWS Config rules can become monotonous to manage because you need to create them individually for each region and account. AWS Config’s conformance packs are collections of rules and remediation actions at a higher, more abstract layer. This feature simplifies organization-wide deployment and compliance reporting by summarizing compliant and noncompliant resources. You can then drill down as needed for details.
When you deploy a conformance pack to an organization’s main (parent class) account, the pack becomes immutable. Member (child class) accounts cannot delete or modify the information. This can prevent development teams from disabling the baseline checks needed for governance. It also streamlines configuration rules and simplifies deployment across AWS organizations within a region.
You can use AWS Config’s configuration item feature to track resources outside of AWS. For on-premises nodes, you use a connector—a mechanism designed to “perform transfer of control and data among components.”1 Here, the connector pulls the data and then calls AWS public APIs to stream that data into AWS Config. You can also track and monitor GitHub repositories, whether public or private, and customize, track, monitor, and ensure compliance for resources not currently supported in AWS.
By combining AWS Config rules with EventBridge events and AWS Lambda, you can implement a custom resource that records the configuration of any active directories not natively supported in AWS Config. For example, you could develop a rule that checks all users’ password configurations in Active Directory and reports as noncompliant any profiles with “password never expires” set to “true.” Figure 4-3 illustrates how this works.

Figure 4-3. Using existing Active Directory groups and roles to invoke AWS Config rule evaluation
The steps are as follows:
Correlating User Activity with CloudTrail
AWS CloudTrail, as we saw earlier, records user activity and API usage across AWS services as events. An event, in this context, is a single request from any source and includes information about the requested action, the date and time of the action, the parameters of the request, and so forth, in JSON format. This can help with security monitoring, troubleshooting, and auditing. CloudTrail turns event records into a single trail or multiple trails (depending on the organization) to deliver log files to an Amazon S3 bucket you specify. You can apply filters to events to pinpoint specific activities.
For advanced or complex queries across multiple fields in a CloudTrail event, you can enable CloudTrail Lake, a feature that uses SQL to bring your data into a single, searchable event data store. This allows you to quickly customize information and perform analyses on streaming data. CloudWatch alerts can be set up to detect unauthorized modifications to a security group. Let’s see how Automatoonz benefits from using CloudTrail.
Dave, the dev team lead, has been making changes to the security group rules to test his application. Since Dave has permission to add new rules, he is changing rules in ways that have not been approved or reviewed by Ravi’s DevSecOps team. This would be fine if Dave was removing the rules he adds after testing, or if those rules were not risky. As of last week, however, Jake, the new DevSecOps engineer, has found 10 instances of port 25 being opened in multiple security groups. It’s so bad that Jake is now spending about half of his time just querying and reverting security group rules.
Ravi and Jake sit down to figure out how to reduce this toil. Ravi presents a solution: using CloudWatch event rules, they can set up event-based actions by monitoring CloudTrail events. Now, they’ll get alerts any time Dave changes the security group rules, and they can tell Dave to clean up the insecure rules immediately.
Although this is a good first step, there is still room for improvement. After adding the alerting mechanism, Ravi spends some time learning about SSM automation documents, which are a sort of playbook with instructions for setting up actions that tell AWS what to do—in this case, either remove or sink the traffic, so the application isn’t exposed.
The flow will look something like this: when Dave edits a security group rule, it triggers a CloudWatch event rule, which starts an SSM automation document, which removes the rule from the security group. Ravi and Jake decide to implement IaC for this process to streamline the work and strengthen standards, readability, accountability, and auditability for the team. This will save Jake time and ensure that nothing is missed because of human error, reducing the risk of security-related exposures or outages.
You can set an alert for any DeleteSecurityGroup events. If you get an alert, you’d then open the AWS Management Console, go to “CloudTrail → Event history” and select DeleteSecurityGroup to see the event. Example 4-4 shows part of a JSON DeleteSecurityGroup event record.
Example 4-4. Output from a DeleteSecurityGroup JSON event record
{
   "eventVersion": "1.08",
   "userIdentity": {
       "type": "AssumedRole",
       "principalId": "AXXXXXXXXXXXX:username",
       "arn": "arn:aws:sts::12345678910:assumed-role/developer/username",
       "accountId": "12345678910",
       "accessKeyId": "AXXXXXXXXXXXXXXX",
       "sessionContext": {
           "sessionIssuer": {
               "type": "Role",
               "principalId": "AXXXXXXXXXXXXXXX",
               "arn": "arn:aws:iam::12345678910:role/developer",
               "accountId": "12345678910",
               "userName": "developer"
           },
           "webIdFederationData": {},
           "attributes": {
               "creationDate": "2022-07-18T00:00:22Z",
               "mfaAuthenticated": "false"
           }
       }
   },
   "eventTime": "2022-07-18T17:12:29Z",
   "eventSource": "ec2.amazonaws.com",
   "eventName": "DeleteSecurityGroup",
   "awsRegion": "us-region-1",
   "sourceIPAddress": "XXXXXXXXXXX",
   "userAgent": "XXXXXXXXXXX",
   "requestParameters": {
       "groupId": "sg-XXXXXXXXXX"
   }
As this Automatoonz example illustrates, correlating CloudTrail events can be very useful as you triage issues in your cloud environment. This practice reduces the time it takes to perform a root cause analysis and figure out a solution.
Network Monitoring with an Amazon VPC
Network monitoring can track transfer rates and connectivity levels, and record ingress and egress traffic to profile baselines for your environment. Amazon virtual private clouds (VPCs) are a core resource component that allows you to launch other AWS resources in a virtual network that you’ve configured. This virtual network is similar to a traditional network in a datacenter, but with the benefits of a native cloud provider. You can further leverage your monitoring and alerting by using a VPC in combination with AWS Config, EventBridge events, CloudWatch alarms, and notifications.
For instance, there’s a predefined AWS Config rule for enabling VPC Flow Logs, called vpc-flow-logs-enabled. VPC Flow Logs forwards IP traffic going to and from network interfaces in your AWS VPC to a logging mechanism. By default, this feature is disabled due to the volume of data it generates.
Flow logs are another source of data you can use to identify security group and network ACL rules that are too open or closed. For more information about VPC Flow Logs, see the official documentation.
The vpc-flow-logs-enabled rule tells AWS Config to detect and track the state of a feature and invoke a custom action if required. If there are route modifications, like network ACL changes, or requirements to track source and destination IP traffic flows, you could develop EventBridge events to detect changes and invoke CloudWatch alarms. Flow log data can be published to, and then viewed in and retrieved from, CloudWatch logs or S3. IPV4 and IPV6 protocols are also supported. Figure 4-4 shows this process.

Figure 4-4. VPC flow logs being streamed to CloudWatch logs for storage
Security groups are stateful, and you add rules that control the traffic based on protocols and port numbers. The IP address and port information are tracked for all traffic; responses are not tracked as new requests. This allows outbound network traffic for the security group rule without additional configurations. You can apply or change security group associations while launching an instance or after the resources are provisioned.
The network access control list (usually called the network ACL) is stateless and allows or denies specific inbound or outbound traffic at the subnet level. Egress and ingress traffic must be explicitly allowed by rules that are evaluated in order, starting with the lowest-numbered rule. This automatically applies to all instances in the subnets with which that network ACL is associated. This provides an additional layer of defense if the security group rules are too permissive.
Let’s look at an example from the official VPC documentation:
You use the
pingcommand from your home computer (IP address is 203.0.113.12) to your instance (the network interface’s private IP address is 172.31.16.139). Your security group’s inbound rules allow ICMP traffic, but the outbound rules do not allow ICMP traffic. Because security groups are stateful, the response ping from your instance is allowed. Your network ACL permits inbound ICMP traffic, but does not permit outbound ICMP traffic. Because network ACLs are stateless, the response ping is dropped and does not reach your home computer.
To see the network activity in a VPC, you have to enable the VPC Flow Logs feature (which is disabled by default due to the amount of data the network traffic generates). A default flow log displays the following two records:
An ACCEPT record for the originating ping that was allowed by both the network ACL and the security group, and therefore was allowed to reach your instance:
2 123456789010 eni-1235b8ca123456789 203.0.113.12 172.31.16.139 0 0 1 4
336 1432917027 1432917142 ACCEPT OK
A REJECT record for the response ping that the network ACL denied:
2 123456789010 eni-1235b8ca123456789 172.31.16.139 203.0.113.12 0 0 1 4
336 1432917094 1432917142 REJECT OK
If your network ACL permits outbound ICMP traffic, the flow log displays two ACCEPT records (one for the originating ping and one for the response ping). If your security group denies inbound ICMP traffic, the flow log displays a single REJECT record, because the traffic was not permitted to reach your instance.
The basics of networking and routing still apply to VPCs—they’re just part of the managed service, to remove some of the heavy lifting and allow you to focus on innovating.
Summary
Ultimately, the goal of a DevSecOps engineer is to maintain the health of the business’s services and provide a consistent, reliable customer experience (internally and externally) while reducing unnecessary security risk. When unexpected events happen, observability mechanisms enable you to answer questions about what has happened, who is affected, and how to resolve the issue as quickly as possible. Intelligent, intentional logging and monitoring for cloud native architectures can improve resolution time while increasing overall customer satisfaction.
A quick recap of key takeaways from this chapter:
Logging and monitoring are constant and dynamic exercises. You will need to actively refine your logging, alerts, and alarms.
It’s important to educate yourself on known and emerging threat types and styles. This will allow you to develop methods to detect and prevent threats and attacks against your environments.
Knowing the different log types allows you to understand where different data is stored and how that information can be accessed. Having this organization helps with data retention, audits, and compliance reviews.
Understanding the latest AWS managed services and their features will help you make sense of existing and new data. You can leverage automation with code to invoke remediation, reducing the time of exposure or risk.
1 Richard N. Taylor, Nenad Medvidovic, and Eric M. Dashofy, Software Architecture: Foundations, Theory, and Practice (John Wiley & Sons, Inc., 2010).
Get Security as Code now with the O’Reilly learning platform.
O’Reilly members experience books, live events, courses curated by job role, and more from O’Reilly and nearly 200 top publishers.

