Chapter 4. Improve Your Architecture with the Modularity Maturity Index
In the last 20 years, a lot of time and money has gone into software systems that have been implemented in modern programming languages such as Java, C#, PHP, etc. The focus in the development projects was often on the quick implementation of features and not on the quality of the software architecture. This practice has led to an increasing amount of technical debt—unnecessary complexity that costs extra money in maintenance—accumulating over time. Today, these systems have to be called legacy systems because their maintenance and expansion is expensive, tedious, and unstable.
This chapter discusses how to measure the amount of technical debt in a software system with the modularity maturity index (MMI). The MMI of a codebase or the different applications in an IT landscape gives management and teams a guideline for deciding which software systems need to be refactored, which should be replaced, and which you don’t need to worry about. The goal is to find out which technical debt should be resolved so that the architecture becomes sustainable and maintenance less expensive.
Technical Debt
The term technical debt was coined by Ward Cunningham in 1992: “Technical debt arises when consciously or unconsciously wrong or suboptimal technical decisions are made. These wrong or suboptimal decisions lead to additional work at a later point in time, which makes maintenance and expansion more expensive.”1 At the time of the bad decision, you start to accumulate technical debt that needs to be paid off with interest if you don’t want to end up overindebted.
In this section, I’ll list two types of technical debt, focusing on the technical debt that can be found through an architectural review:
- Implementation debt
- The source code contains so-called code smells, such as long methods and empty catch blocks. Implementation debt can now be found in the source code in a largely automated manner using a variety of tools. Every development team should gradually resolve this debt in their daily work without the extra budget being required.
- Design and architecture debt
- The design of the classes, packages, subsystems, layers, and modules, and the dependencies among them are inconsistent and complex and do not match the planned architecture. This debt cannot be determined by simply counting and measuring, and it requires extensive architecture review, which is presented in “Architecture Review to Determine the MMI”.
Other problem areas that can also be seen as the debt of software projects, such as missing documentation, poor test coverage, poor usability, or inadequate hardware, are left out here because they don’t belong to the category of technical debt.
Origination of Technical Debt
Let’s look at the origination and effect of technical debt. If a high-quality architecture was designed at the beginning of a software development project, then one can assume that the software system can be maintained easily at the beginning. In this initial stage, the software system is in the corridor of low technical debt with the same maintenance effort, as you’ll see in Figure 4-1.
If the system is expanded more and more during maintenance and to integrate changes, technical debt inevitably arises (indicated by the upward-pointing arrows in Figure 4-1). Software development is a constant learning process where the first throw of a solution is rarely the final one. The revision of the architecture (architecture improvement, shown with downward-pointing arrows) must be carried out at regular intervals. This creates a constant sequence of maintenance/change and architecture improvement.
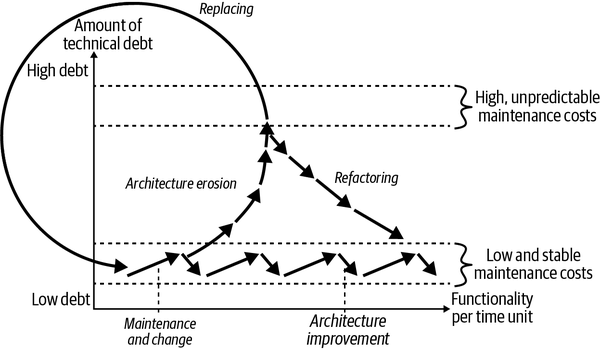
Figure 4-1. Origination and effect of technical debt
If a team can follow a constant sequence of expansion and architecture improvement permanently, the system will remain in the corridor of low and stable maintenance costs. Unfortunately, this aspect of architecture improvement has only really become a reality for many budget managers in recent years—too late for most systems that started in the early 2000s.
If the development team is not allowed to continuously reduce the technical debt, architectural erosion will inevitably set in over time, as shown by the ascending arrows that leave the corridor of low and stable maintenance costs in Figure 4-1. This process is called architecture erosion. Once technical debt has been piled up, maintaining and changing the software becomes more and more expensive, and consequential errors more and more difficult to understand, to the point where every change becomes a painful effort. Figure 4-1 makes this slow decay clear by the fact that the upward-pointing arrows keep getting shorter. With increasing debt, less and less functionality can be implemented per unit of time.
There are two ways to get out of this technical debt dilemma:
- Refactoring
- You can refactor the legacy system from the inside out and thus increase the speed of development and stability again. On this usually arduous path, the system must be brought back step-by-step into the corridor of low and stable maintenance costs (see descending arrows marked “Refactoring” in Figure 4-1).
- Replacing
- Or you can replace the legacy system with another software that has less technical debt (see the circle in Figure 4-1).
Of course, it could be that there was no capable team on site at the beginning of the development. In this case, technical debt is taken up right at the start of development and continuously increased. One can say this about such software systems: they grew up under poor conditions. Neither the software developers nor the management will enjoy a system in such a state in the long term.
Such a view of technical debt is understandable and comprehensible for most budget managers. Nobody wants to pile up technical debt and slowly get bogged down with developments until every adjustment becomes an incalculable cost screw. The aspect that continuous work is required in order to keep the technical debt low over the entire service life of the software can also be conveyed well. Most non-IT people are now well aware of the problem, but how can you actually assess the debt in a software system?
Assessment with the MMI
My doctoral thesis on architecture and cognitive science, as well as the results from more than three hundred architectural assessments, made it possible for me and my team to create a uniform evaluation scheme, named the MMI, to compare the technical debt accumulated in the architecture of various systems.
Cognitive science shows us that during evolution, the human brain has acquired some impressive mechanisms that help us deal with complex structures, such as organization of regimes, layout of towns and countries, genealogical relationships, and so forth. Software systems are unquestionably complex structures as well because of their size and the number of elements they contain. In my doctoral thesis, I related findings from cognitive psychology about three mechanisms our brains use to deal with complexity (chunking, building hierarchies, and building schemata) in important architecture and design principles in computer science (modularity, hierarchy, and pattern consistency). In this chapter, I can only provide abbreviated explanations of these relationships. The full details, especially on cognitive psychology, can be found in my book,2 which grew out of my doctoral thesis.
These principles have the outstanding property that they favor mechanisms in our brain for dealing with complex structures. Architectures and designs that follow these principles are perceived by people as uniform and understandable, making them easier to maintain and expand. Therefore, these principles must be used in software systems so that maintenance and expansion can be carried out quickly and without many errors. The goal is that we can continue to develop our software systems with changing development teams for a long time while maintaining the same quality and speed in development.
Modularity
In software development, modularity is a principle introduced by David Parnas in the 1970s. Parnas argued that a module should contain only one design decision (encapsulation) and that the data structure for this design decision should be encapsulated in the module locality.3
In modern programming languages, modules are units within a software system, such as classes, components, or layers. Our brain loves to reason about systems on various levels of units to achieve capacity gain in our memory. The crucial point here is that our brain benefits from these units only if the details can be represented as a coherent unit that forms something meaningful. Program units that combine arbitrary, unrelated elements are therefore not meaningful and will not be accepted by our brain. Thus, a modular system with coherent and meaningful program units will have low technical debt and low unnecessary complexity.
Whether the program units represent coherent and meaningful elements in a software architecture can only be assessed qualitatively. This qualitative assessment is supported by various measurements and examinations:
- Cohesion through coupling
- Units should contain subunits that belong together, which means that their cohesion with each other should be high and their coupling to the outside should be low. For example, if the submodules of a module have higher coupling with other modules than with their “sisters and brothers,” then their cohesion with one another is low and the modularity is not well done. Unlike cohesion, coupling is measurable.
- Names
- If the program units of a system are modular, you should be able to answer the following question for each unit: what is its task? The key point here is that the program unit really has one task and not several. A good clue for unclear responsibilities is the names of the units, which should describe their tasks. If the name is vague, it should be looked at. Unfortunately, this is not measurable.
- Well-balanced proportions
- Modular program units that are on one level, such as layers, components, packages, classes, and methods, should have well-balanced proportions. Here it is worth examining the very large program units to determine whether they are candidates for decomposition. An extreme example can be seen in Figure 4-2. In the left diagram, you can see the sizes of a system’s nine build units in a pie chart: the team told us that the build units reflect the planned modules of the system. One build unit represents the largest part of the pie chart, which is 950.860 lines of code (LOC). The other eight build units add up to only 84.808 LOC, which is extremely unbalanced. On the right side of Figure 4-2, you can see the architecture of the system with the nine build units as squares and the relationships between the build units as arcs. The part of the system called “Monolith” is the big one from the pie chart. It is using the eight small build units, which we call “Satellite X” here. The dark shade of the Monolith’s square compared to the light shade of the satellites indicates, just like the pie chart, that this is where most of the source code is located. This system’s modularity is not well-balanced. This indicator is measurable.
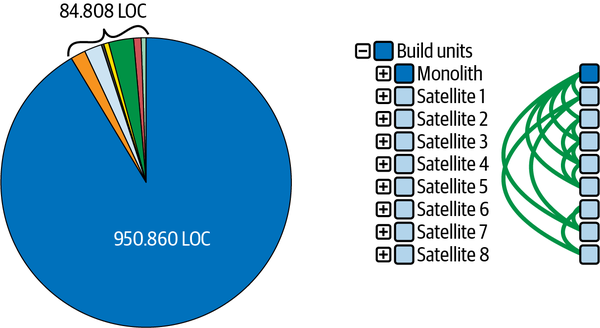
Figure 4-2. Extreme proportions
You can carry out similar evaluations at all levels to check the modularity of a system. The influence of each point on the calculation of the MMI follows the explanation of hierarchies and pattern consistency.
Hierarchy
Hierarchies play an important role in perceiving and understanding complex structures and in storing knowledge. People can absorb knowledge well, reproduce it, and find their way around it if it is in hierarchical structures. The formation of hierarchies is supported in programming languages in contain-being relationships: classes are in packages, packages in turn are in packages and, finally, in projects or build artifacts. These hierarchies fit our cognitive mechanisms.
Unlike the contain-being relationship, use and inherit relationships can be used in a way that does not create hierarchies: we can link any classes and interfaces in a source codebase using use and/or inherit relationships. In this way, we create intertwined structures that are in no way hierarchical. In our discipline, we then speak of class cycles, package cycles, cycles between modules, and upward relationships between the layers of an architecture. In my architecture reviews, I see the whole range, from very few cyclical structures to large cyclical monsters.
Figure 4-3 shows a class cycle of 242 classes. Each rectangle represents a class, and the lines between them represent their relationships. This cycle is distributed over 18 directories, and they all need each other to carry out their tasks.
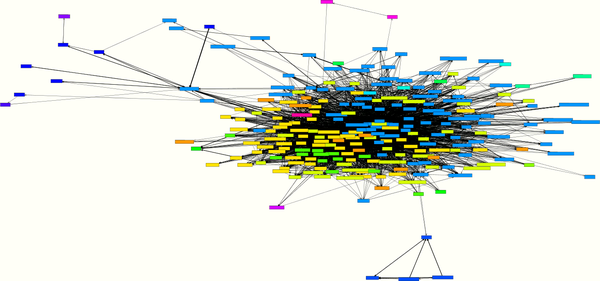
Figure 4-3. A cycle with 242 classes
The system from which the cycle in Figure 4-3 originates has a total of 479 classes. So here, over half of all classes (242) need each other, directly or indirectly. In addition, this cycle has a strong concentration in the center and few satellites. There is no natural possibility of breaking this cycle down but a whole lot of work in redesigning these classes. It is much better to make sure from the beginning that such large cycles do not occur. Fortunately, most systems have smaller and less concentrated cycles that can be broken down with a few refactorings.
Figure 4-4 shows a nonhierarchical structure on the architectural level. Four technical layers of a small application system (80,000 LOC)—App, Services, Entities, and Util—lie on top of each other and use each other, as intended, mainly from top to bottom (downward-pointing arrows on the left). Some back references (upward-pointing arrows on the right) have crept in between the layers, which lead to cycles between the layers and thus architectural violations.
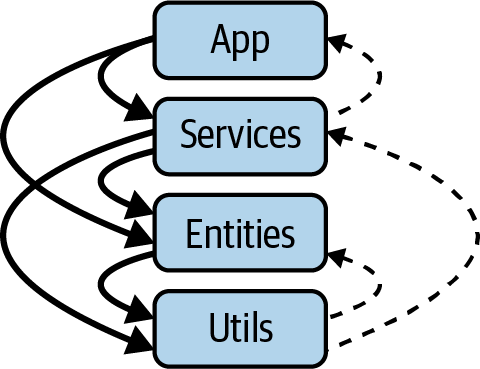
Figure 4-4. Cycles at the architecture level
The violations in this layered architecture are caused by only 16 classes and were easy to resolve. Again, for these types of cycles or violations of layering, the sooner you find and refactor them, the better.
The good news is that cycles are easy to measure at all levels, and thus the hierarchy of a system can be checked precisely. The influence of each point on the calculation of the MMI follows the explanation of pattern consistency.
Pattern Consistency
The most efficient mechanism that humans use to structure complex relationships are schemas. A schema summarizes the typical properties of similar things or connections as an abstraction. For example, if you are informed that a person is a teacher, then on the abstract level your schema contains different assumptions and ideas about the associated activity: teachers are employed at a school, they do not have an eight-hour working day, and they must correct class tests. Specifically, you will remember your own teachers, whom you have stored as prototypes of the teacher schema.
If you have a schema for a context in your life, you can understand and process questions and problems much more quickly than you could without a schema. For example, the design patterns that are widely used in software development use the strength of the human brain to work with schemas. If developers have already worked with a design pattern and created a schema from it, they can more quickly recognize and understand program texts and structures that use this design pattern.
The use of schemas provides us in our daily lives with decisive speed advantages for understanding complex structures. This is also why patterns found their way into software development years ago. For developers and architects, it is important that patterns exist, that they can be found in the source code, and that they are used consistently. Therefore, consistently applied patterns help us deal with the complexity of source code.
Figure 4-5 shows, on the left side, a diagram that a team developed to record their design patterns in a tool that allows them to collect classes of one pattern into a layer. On the right, the source code is divided into these design patterns, and you can see a lot of arcs on the left side of the axis, which are going downward so they fit the diagram. The arcs on the left side of the axis go downward and the arcs on the right go against the layering upward. A few arcs on the right side of the axis go against the layering from bottom to top. This is typical; design patterns form hierarchical structures. The design patterns are well implemented in this system because there are mainly left-side arcs (relationships from top to bottom) and very few right-side arcs (relationships from bottom to top, against the direction given by the patterns).
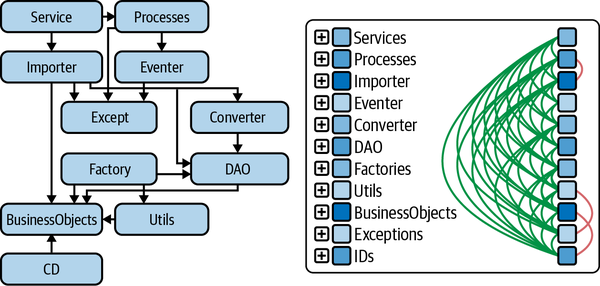
Figure 4-5. Pattern at class level = pattern language
Examining the patterns in the source code is usually the most exciting part of an architecture review. Here you have to grasp the level at which the development team is really working. The classes that implement the individual patterns are often distributed across the packages or directories. By modeling the pattern shown in Figure 4-5 on the right, this level of the architecture can be made visible and analyzable.
Pattern consistency cannot be measured directly like hierarchies can, but in the next section, we will compile some measurements that are used to evaluate pattern consistency in the MMI.
Calculating the MMI
The MMI is calculated from various criteria and metrics with which we try to map the three principles of modularity, hierarchies, and pattern consistency. In the overall calculation of the MMI, the three principles are included with a percentage and have different criteria that are calculated for them using the instructions in Table 4-1. Modularity has the strongest influence on the MMI, with 45%, because modularity is also the basis for hierarchy and for pattern consistency. That is also why the MMI carries that name.4
The criteria in Table 4-1 can be determined with metrics tools, architecture analysis tools, or the reviewer’s judgment (see the “Determined by” column). There are a number of metrics tools to measure exact values, but for MMI comparability, the implementation of each metric used in the particular tool must be considered. The reviewer’s judgment cannot be measured but is at the discretion of the reviewer. The architecture analysis tools are measurable but depend heavily on the reviewer’s insights.
To evaluate these nonmeasurable criteria in my workplace, reviewers depend on discussions with the developers and architects. This takes place in on-site or remote workshops. We also discuss the system from various architectural perspectives, with the help of an architecture analysis tool.5 To ensure the greatest possible compatibility, we always carry out reviews in pairs and then discuss the results in a larger group of architecture reviewers.
| Category | Subcategory | Criteria | Determined by |
|---|---|---|---|
| 1. Modularity (45%) | |||
| 1.1. Domain and technical modularization (25%) | |||
| 1.1.1. Allocation of the source code to domain modules in % of the total source code | Architecture analysis tools | ||
| 1.1.2. Allocation of the source code to the technical layers in % of the total source code | Architecture analysis tools | ||
| 1.1.3. Size relationships of the domain modules [(LoC max/LoC min)/number] | Metrics tools | ||
| 1.1.4. Size relationships of the technical layers [(LoC max/LoC min)/number] | Metrics tools | ||
| 1.1.5. Domain modules, technical layers, packages, classes have clear responsibilities | Reviewers | ||
| 1.1.6. Mapping of the technical layers and domain modules through packages/namespaces or projects | Reviewers | ||
| 1.2. Internal Interfaces (10%) | |||
| 1.2.1. Domain or technical modules have interfaces (% violations) | Architecture analysis tools | ||
| 1.2.2. Mapping of the internal interfaces through packages/namespaces or projects | Reviewers | ||
| 1.3. Proportions (10%) | |||
| 1.3.1. % of the source code in large classes | Metrics tools | ||
| 1.3.2. % of the source code in large methods | Metrics tools | ||
| 1.3.3. % of the classes in large packages | Metrics tools | ||
| 1.3.4. % of the methods of the system with a high cyclomatic complexity | Metrics tools | ||
| 2. Hierarchy (30%) | |||
| 2.1. Technical and domain layering (15%) | |||
| 2.1.1. Number of architecture violations in the technical layering (%) | Architecture analysis tools | ||
| 2.1.2. Number of architecture violations in the layering of the domain modules (%) | Architecture analysis tools | ||
| 2.2. Class and package cycles (15%) | |||
| 2.2.1. Number of classes in cycles (%) | Metrics tools | ||
| 2.2.2. Number of packages in cycles (%) | Metrics tools | ||
| 2.2.3. Number of classes per cycle | Metrics tools | ||
| 2.2.4. Number of packages per cycle | Metrics tools | ||
| 3. Pattern consistency (25%) | |||
| 3.1. Allocation of the source code to the pattern in % of the total source code | Architecture analysis tools | ||
| 3.2. Relationships of the patterns are cycle-free (% violations) | Architecture analysis tools | ||
| 3.3. Explicit mapping of the patterns (via class names, inheritance, or annotations) | Reviewers | ||
| 3.4. Separation of domain and technical source code (DDD, Quasar, Hexagonal) | Reviewers |
The MMI is calculated by determining a number between 0 and 10 for each criterion using Table 4-2. The resulting numbers per section are added up and divided by the number of criteria in question from Table 4-1. The result is recorded in the MMI with the percentage of the respective principle so that a number between 0 and 10 can be determined.
| Sect. | 0 | 1 | 2 | 3 | 4 | 5 | 6 | 7 | 8 | 9 | 10 |
|---|---|---|---|---|---|---|---|---|---|---|---|
| 1.1.1 | <=54% | >54% | >58% | >62% | >66% | >70% | >74% | >78% | >82% | >86% | >90% |
| 1.1.2 | <=75% | >75% | >77.5% | >80% | >82.5% | >85% | >87.5% | >90% | >92.5% | >95% | >97.5% |
| 1.1.3 | >=7.5 | <7.5 | <5 | <3.5 | <2.5 | <2 | <1.5 | <1.1 | <0.85 | <0.65 | <0.5 |
| 1.1.4 | >=16.5 | <16.5 | <11 | <7.5 | <5 | <3.5 | <2.5 | <2 | <1.5 | <1.1 | <0.85 |
| 1.1.5 | No | partial | Yes, all | ||||||||
| 1.1.6 | No | partial | Yes | ||||||||
| 1.2.1 | >=6.5% | <6.5% | <4% | <2.5% | <1.5% | <1% | <0.65% | <0.4% | <0.25% | <0.15% | <0.1% |
| 1.2.2 | No | partial | Yes | ||||||||
| 1.3.1 | >=23% | <23% | <18% | <13.5% | <10.5% | <8% | <6% | <4.75% | <3.5% | <2.75% | <2% |
| 1.3.2 | >=23% | <23% | <18% | <13.5% | <10.5% | <8% | <6% | <4.75% | <3.5% | <2.75% | <2% |
| 1.3.3 | >=23% | <23% | <18% | <13.5% | <10.5% | <8% | <6% | <4.75% | <3.5% | <2.75% | <2% |
| 1.3.4 | >=3.6% | <3.6% | <2.6% | <1.9% | <1.4% | <1% | <0.75% | <0.5% | <0.4% | <0.3% | <0.2% |
| 2.1.1 | >=6.5% | <6.5% | <4% | <2.5% | <1.5% | <1% | <0.65% | <0.4% | <0.25% | <0.15% | <0.1% |
| 2.1.2 | >=14% | <14% | <9.6% | <6.5% | <4.5% | <3.2% | <2.25% | <1.5% | <1.1% | <0.75% | <0.5% |
| 2.2.1 | >=25% | <25% | <22.5% | <20% | <17.5% | <15% | <12.5% | <10% | <7.5% | <5% | <2.5% |
| 2.2.2 | >=50% | <50% | <45% | <40% | <35% | <30% | <25% | <20% | <15% | <10% | <5% |
| 2.2.3 | >=106 | <106 | <82 | <62 | <48 | <37 | <29 | <22 | <17 | <13 | <10 |
| 2.2.4 | >=37 | <37 | <30 | <24 | <19 | <15 | <12 | <10 | <8 | <6 | <5 |
| 3.1 | <=54.5% | >54.5% | >59% | >63.5% | >68% | >72.5% | >77% | >81.5% | >86% | >90.5% | >95% |
| 3.2 | >=7.5% | <7.5% | <5% | <3.5% | <2.5% | <2% | <1.5% | <1.1% | <0.85% | <0.65% | <0.5% |
| 3.3 | No | partial | Yes | ||||||||
| 3.4 | No | partial | Yes |
Figure 4-6 shows a selection of 18 software systems that we assessed over a period of 5 years (x-axis). For each system, the size is shown in lines of code (size of the point) and the MMI on a scale from 0 to 10 (y-axis).
If a system is rated between 8 and 10, the share of technical debt is low. The system is in the corridor low and stable maintenance and costs (from Figure 4-1). Systems in Figure 4-6 with a rating between 4 and 8 have already collected quite a bit of technical debt. Corresponding refactorings are necessary here to improve the quality. Systems below mark 4 can only be maintained and expanded with a great deal of effort (see the Figure 4-1 corridor with high and unpredictable maintenance costs). With these systems, it must be carefully weighed whether it is worth upgrading through refactoring or whether the system should be replaced.
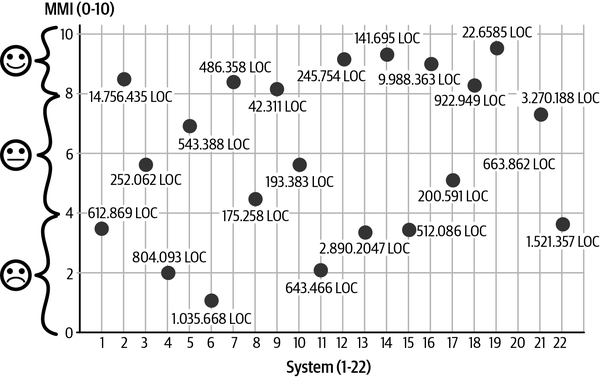
Figure 4-6. The MMI for different systems
Architecture Review to Determine the MMI
Most development teams can instantly enumerate a list of design and architectural debts for the system they are developing. This list is a good starting point for analyzing technical debt. To get to the bottom of the design and architecture debts, an architecture analysis is recommended. An architecture analysis can be used to check to what extent the planned target architecture has been implemented in the source code (see Figure 4-7) that represents the actual architecture. The target architecture is the plan for the architecture that exists on paper or in the mind of the architect and developer. Several good tools are available today for such target-to-actual comparisons, including Lattix, Sotograph/SotoArc, Sonargraph, Structure101, and TeamScale.
As a rule, the actual architecture in the source code differs from the planned target architecture. There are many reasons for this. Deviations often occur unnoticed because development environments only provide a local insight into the source code that is currently being processed and do not provide an overview. A lack of knowledge about the architecture in the development team also leads to this effect. In other cases, the deviations between the target and the actual architecture are deliberately entered into because the team is under time pressure and needs a quick solution. The necessary refactoring will then be postponed indefinitely.

Figure 4-7. Review of target and actual architecture
Figure 4-8 shows the sequence of an architecture analysis to identify technical debts. An architecture analysis is carried out by a reviewer together with the architects and developers of the system in a workshop. At the beginning of the workshop, the system’s source code is parsed with the analysis tool (1), and the actual architecture is recorded. The target architecture is now modeled on the actual architecture so that the target and actual can be compared (2).
Technical debts become visible, and the reviewer, together with the development team, searches for simple solutions on how the actual architecture can be adjusted to the target architecture by refactoring (3). Or the reviewer and development team discover in the discussion that the solution chosen in the source code is better than the original plan.
Sometimes, however, neither the target architecture nor the deviating actual architecture is the best solution, and the reviewer and development team have to work together to design a new target image for the architecture. In the course of such an architecture review, the reviewer and the development team collect technical debt and possible refactorings (4). Finally, we look at different metrics (5) to find more technical debt, such as large classes, too-strong coupling, cycles, and so on.
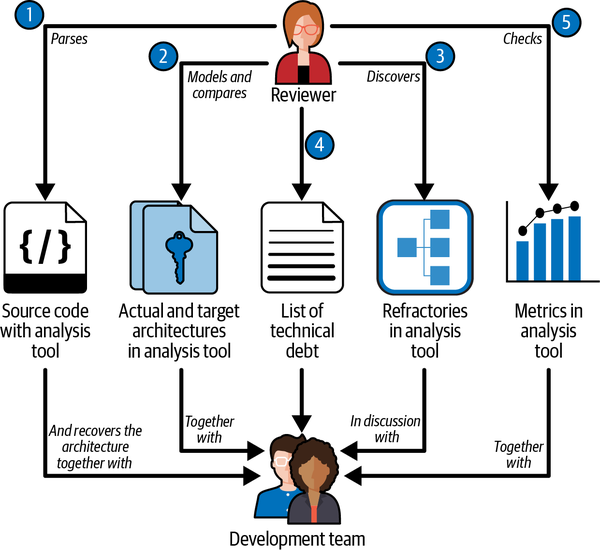
Figure 4-8. Architecture review for determining the MMI
Conclusion
The MMI determines the extent of technical debt in a legacy system. Depending on the result in the areas of modularity, hierarchy, and pattern consistency, the need for refactoring or a possible replacement of the system can be determined. If the result is less than 4, it must be considered whether it makes sense to replace the system with a different system that is burdened with less technical debt. If the system is between 4 and 8, renewing is usually cheaper than replacing. In this case, the team should work with the reviewer to define and prioritize refactorings that reduce the technical debt. Step by step, these refactorings must be planned into the maintenance or expansion of the system, and the results must be checked regularly. In this way, a system can be gradually transferred to the area of “constant effort for maintenance.”
A system with an MMI of over 8 is a great pleasure for the reviewers. As a rule, we notice that the team and its architects have done a good job and are proud of their architecture. In such a case, we are very happy to be able to rate the work positively with the MMI.
1 Ward Cunningham, “The WyCash Portfolio Management System: Experience Report,” OOPSLA ’92, Vancouver, BC, 1992.
2 Carola Lilienthal, “Sustainable Software Architecture” (doctoral thesis, Dpunkt.verlag, 2019).
3 David Parnas, “On the Criteria to be Used in Decomposing Systems into Modules,” Communications of the ACM 15, no. 12 (1972): 1053–1058.
4 Lilienthal, “Sustainable Software Architecture.”
5 In my own analysis I use Sotograph, Sonargraph, Lattix, Structure101, and TeamScale.
Get Software Architecture Metrics now with the O’Reilly learning platform.
O’Reilly members experience books, live events, courses curated by job role, and more from O’Reilly and nearly 200 top publishers.

