12.1 Introducing an Additional Dimension to our Statistical Analysis
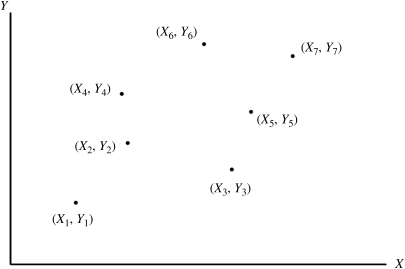
Throughout most of this book, we dealt exclusively with a single quantitative variable X with observations X1, . . ., Xn, that is, we worked with so-called univariate data. However, as everyone knows, the world is not one-dimensional. Observations on X can also be studied relative to, or in contrast with, observations on another quantitative variable Y with values Y1, . . ., Yn. In this regard, the X versus Y data values can be represented as a set of ordered pairs (Xi, Yi), i = 1, . . ., n, in the X-Y-plane (Fig. 12.1). This type of two-dimensional graph is termed a scatter diagram involving bivariate data. Such data will now constitute a sample of size n.
Figure 12.1 Scatter diagram for (Xi, Yi), i = 1, . . ., 7.

A scatter diagram can be used to “detect” a relationship between the X and Y variables. For instance, Fig. 12.2a shows a direct relationship between X and Y (both variables increase or decrease together); Fig. 12.2b exhibits an inverse relationship between X and Y (these variables move in opposite directions); Fig. 12.2c displays a nonlinear relationship between X and Y; and, in Fig. 12.2d, there is no determinate relationship between these variables.
Figure 12.2 Relationships between X and Y.

Get Statistical Inference: A Short Course now with the O’Reilly learning platform.
O’Reilly members experience books, live events, courses curated by job role, and more from O’Reilly and nearly 200 top publishers.

