April 2024
Intermediate
5 pages
5m
English
When working in Tableau, you often want to see how items distribute over a range. For example, perhaps you want to see the range of profits for all your orders over the past few years. In Tableau, you would build a scatter plot by year to show the most common profit values for all your orders. The year of the Order Date would be on the Columns pane, the Profit measure would be on the Rows pane, and the Order ID would be added to Details on the Marks pane to split all the orders into unique points. The chart may look similar to the one shown.
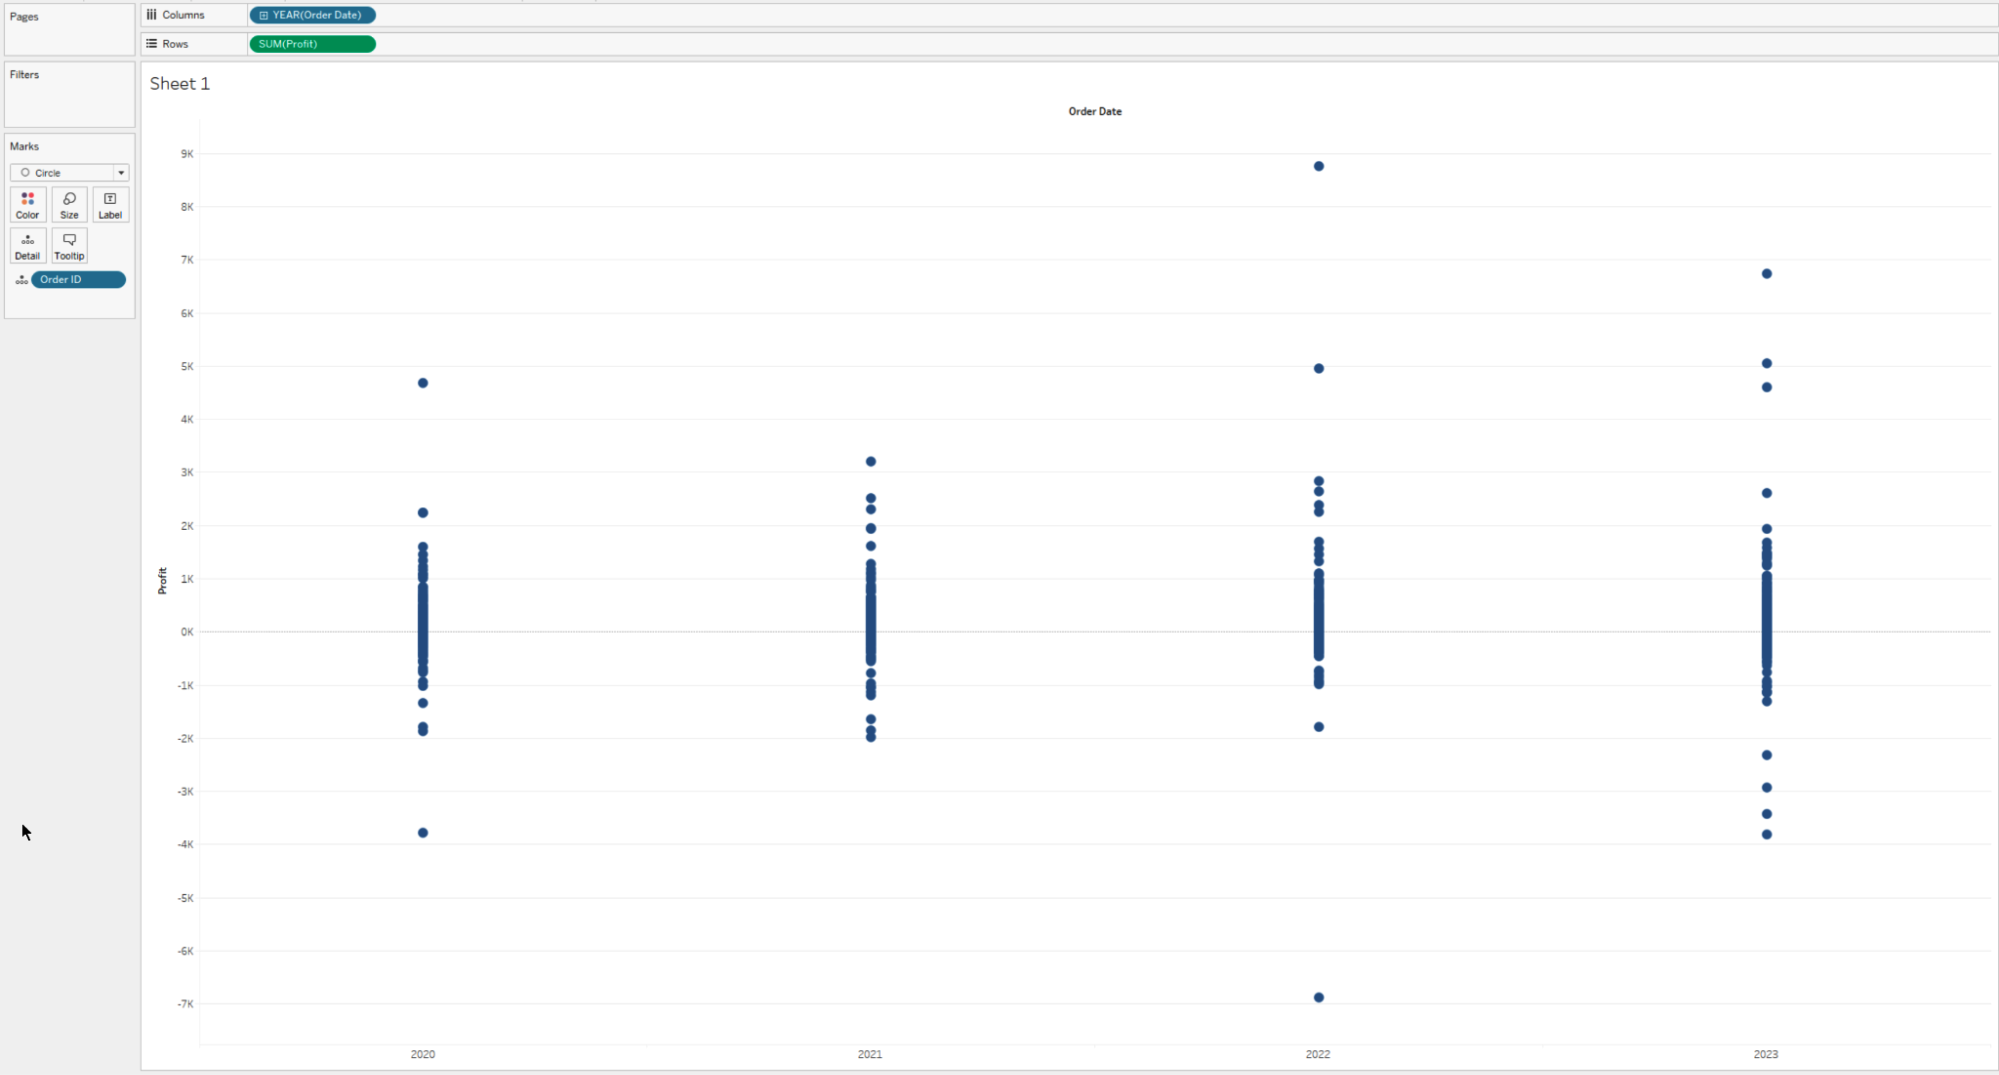
Looking at this scatter plot is a bit misleading. There are many orders each year that bring in matching or very similar profit values. As a result, the dots begin to overlap and cover each other up, hiding the true volume of orders. How would you go about uncovering these hidden points? How would you more accurately illustrate the volume of orders each year at each profit value? There are two ways to separate the points, also known as adding jitter, to make them more readable. Both involve simple calculations.
The first method to spread apart the values is to let Tableau assign a random value to each order and then plot that value within the year. This sounds complicated, but is really quite simple ...
Read now
Unlock full access


 O’Reilly covers everything we've got, with content to help us build a world-class technology community, upgrade the capabilities and competencies of our teams, and improve overall team performance as well as their engagement.I wanted to learn C and C++, but it didn't click for me until I picked up an O'Reilly book. When I went on the O’Reilly platform, I was astonished to find all the books there, plus live events and sandboxes so you could play around with the technology.I’ve been on the O’Reilly platform for more than eight years. I use a couple of learning platforms, but I'm on O'Reilly more than anybody else. When you're there, you start learning. I'm never disappointed.I'm always learning. So when I got on to O'Reilly, I was like a kid in a candy store. There are playlists. There are answers. There's on-demand training. It's worth its weight in gold, in terms of what it allows me to do.