7.2. Debugging by Induction
It should be obvious that careful thought will find most errors without the debugger even going near the computer. One particular thought process is induction, where you move from the particulars of a situation to the whole. That is, start with the clues (the symptoms of the error, possibly the results of one or more test cases) and look for relationships among the clues. The induction process is illustrated in Figure 7.1.
Figure 7.1. The inductive debugging process.
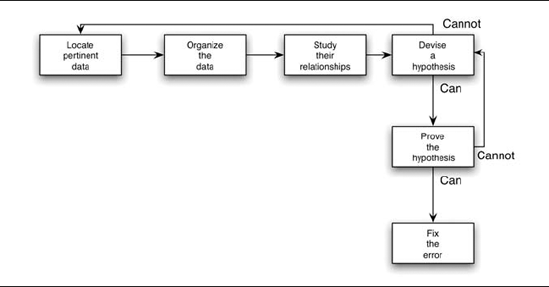
The steps are as follows:
Locate the pertinent data. A major mistake debuggers make is failing to take account of all available data or symptoms about the problem. The first step is the enumeration of all you know about what the program did correctly and what it did incorrectly—the symptoms that led you to believe there was an error. Additional valuable clues are provided by similar, but different, test cases that do not cause the symptoms to appear.
Organize the data. Remember that induction implies that you're processing from the particulars to the general, so the second step is to structure the pertinent data to let you observe the patterns. Of particular importance is the search for contradictions, events such as that the error occurs only when the customer has no outstanding balance in his or her margin account. You can use a form such as the one shown in Figure 7.2 to structure the ...
Get The Art of Software Testing, Second Edition now with the O’Reilly learning platform.
O’Reilly members experience books, live events, courses curated by job role, and more from O’Reilly and nearly 200 top publishers.

