So, you’re all ready to get started on your first data journalism project. What now? First of all you need some data. This section looks at where you can get it from. We learn how to find data on the web, how to request it using freedom of information laws, how to use “screen-scraping” to gather data from unstructured sources, and how to use “crowd-sourcing” to collect your own datasets from your readers. Finally we look at what the law says about republishing datasets, and how to use simple legal tools to let others reuse your data.
Looking for data on a particular topic or issue? Not sure what exists or where to find it? Don’t know where to start? In this section we look at how to get started with finding public data sources on the web.
While they may not always be easy to find, many databases on the web are indexed by search engines, whether the publisher intended this or not. Here are a few tips:
- When searching for data, make sure that you include both search terms relating to the content of the data you’re trying to find, as well as some information on the format or source that you would expect it to be in. Google and other search engines allow you to search by file type. For example, you can look only for spreadsheets (by appending your search with “filetype:XLS filetype:CSV”), geodata (“filetype:shp”), or database extracts (“filetype:MDB, filetype:SQL, filetype:DB”). If you’re so inclined, you can even look for PDFs (“filetype:pdf”).
- You can also search by part of a URL. Googling for “inurl:downloads filetype:xls” will try to find all Excel files that have “downloads” in their web address (if you find a single download, it’s often worth just checking what other results exist for the same folder on the web server). You can also limit your search to only those results on a single domain name, by searching for “site:agency.gov”, for example.
- Another popular trick is not to search for content directly, but for places where bulk data may be available. For example, “site:agency.gov Directory Listing” may give you some listings generated by the web server with easy access to raw files, while “site:agency.gov Database Download” will look for intentionally created listings.
Over the last few years, a number of dedicated data portals, data hubs, and other data sites have appeared on the web. These are a good place to get acquainted with the kinds of data that is out there. For starters you might like to take a look at:
- Official data portals
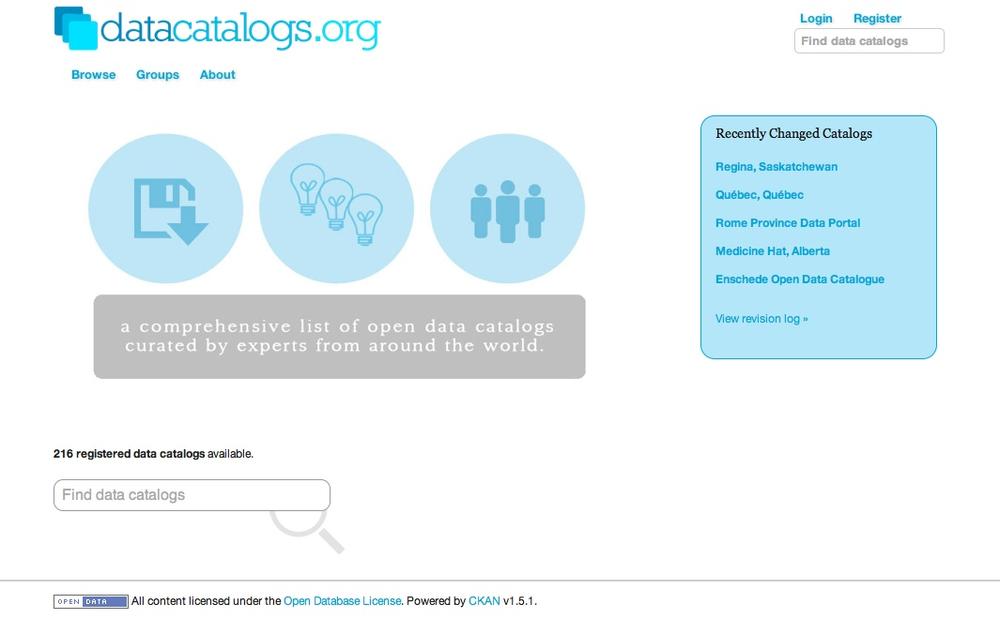
- The government’s willingness to release a given dataset will vary from country to country. A growing number of countries are launching data portals (inspired by the U.S.’s data.gov and the U.K.’s data.gov.uk) to promote the civic and commercial reuse of government information. An up-to-date, global index of such sites can be found at http://datacatalogs.org/. Another handy site is the Guardian World Government Data, a meta search engine that includes many international government data catalogues.
- The Data Hub
- A community-driven resource run by the Open Knowledge Foundation that makes it easy to find, share, and reuse openly available sources of data, especially in ways that are machine-automated.
- ScraperWiki
- An online tool to make the process of extracting “useful bits of data easier so they can be reused in other apps, or rummaged through by journalists and researchers.” Most of the scrapers and their databases are public and can be reused.
- World Bank and United Nations data portals
- These services provide high-level indicators for all countries, often for many years in the past.
- Buzzdata, Infochimps, and DataMarket
- Emerging startups that aim to build communities around data sharing and resale.
- DataCouch
- A place to upload, refine, share, and visualize your data.
- Freebase
- An interesting Google subsidiary that provides “an entity graph of people, places and things, built by a community that loves open data.”
- Research data
- There are numerous national and disciplinary aggregators of research data, such as the UK Data Archive. While there will be lots of data that is free at the point of access, there will also be much data that requires a subscription, or which cannot be reused or redistributed without asking permission first.
Search for existing answers or ask a question at Get The Data or Quora. GetTheData is Q&A site where you can ask your data-related questions, including where to find data relating to a particular issue, how to query or retrieve a particular data source, what tools to use to explore a dataset in a visual way, how to cleanse data, or get it into a format you can work with.
Mailing lists combine the wisdom of a whole community on a particular topic. For data journalists, the Data-Driven Journalism List and the NICAR-L lists are excellent starting points. Both of these lists are filled with data journalists and Computer-Assisted Reporting (CAR) geeks, who work on all kinds of projects. Chances are that someone may have done a story like yours, and may have an idea of where to start, if not a link to the data itself. You could also try Project Wombat (http://project-wombat.org/; “a discussion list for difficult reference questions”), the Open Knowledge Foundation’s many mailing lists, mailing lists at theInfo, or searching for mailing lists on the topic or in the region that you are interested in.
Hacks/Hackers is a rapidly expanding international grassroots journalism organization with dozens of chapters and thousands of members across four continents. Its mission is to create a network of journalists (“hacks”) and technologists (“hackers”) who rethink the future of news and information. With such a broad network, you stand a strong chance of someone knowing where to look for the thing you seek.
Professors, public servants, and industry folks often know where to look. Call them. Email them. Accost them at events. Show up at their office. Ask nicely. “I’m doing a story on X. Where would I find this? Do you know who has this?”
Understanding the technical and administrative context in which governments maintain their information is often helpful when trying to access data. Whether it’s CORDIS, COINS, or THOMAS, big-acronym databases often become most useful once you understand a bit about their intended purpose.
Find government organizational charts and look for departments/units with a cross-cutting function (e.g., reporting, IT services), then explore their websites. A lot of data is kept in multiple departments and while for one, a particular database may be their crown jewels, another may give it to you freely.
Look out for dynamic infographics on government sites. These are often powered by structured data sources/APIs that can be used independently (e.g., flight tracking applets, weather forecast Java apps).
When you know more about what you are looking for, search again using phrases and improbable sets of words you’ve spotted since last time. You may have a bit more luck with search engines!
If you believe that a government body has the data you need, a Freedom of Information request may be your best tool. See the next section for more information on how to file one.
— Brian Boyer (Chicago Tribune), John Keefe (WNYC), Friedrich Lindenberg (Open Knowledge Foundation), Jane Park (Creative Commons), Chrys Wu (Hacks/Hackers)
Before you make a Freedom of Information (FOI) request, you should check to see if the data you are looking for is already available—or has already been requested by others. The previous chapter has some suggestions for where you might look. If you’ve looked around and still can’t get hold of the data you need, then you may wish to file a formal request. Here are some tips that may help to make your request more effective:
- Plan ahead to save time
- Think about submitting a formal access request whenever you set out to look for information. It’s better not to wait until you have exhausted all other possibilities. You will save time by submitting a request at the beginning of your research and carrying out other investigations in parallel. Be prepared for delay: sometimes public bodies take a while to process requests, so it is better to expect this.
- Check the rules about fees
- Before you start submitting a request, check the rules about fees for either submitting requests or receiving information. That way, if a public official suddenly asks you for money, you will know what your rights are. You can ask for electronic documents to avoid copying and posting costs, mention in your request that you would prefer the information in electronic format. That way you will avoid paying a fee, unless of course the information is not available electronically, although these days, it’s usually possible to scan documents which are not already digitalized and then to send them as an attachment by email.
- Know your rights
- Find out what your rights are before you begin, so you know where you stand and what the public authorities are and are not obliged to do. For example, most freedom of information laws provide a time limit for authorities to reply to you. Globally, the range in most laws is from a few days to one month. Make sure that you know what this is before you set out, and make a note of when you submit your request.
Governments are not obliged to process data for you, but should give you all the data they have, and if it is data that they should have in order to perform their legal competencies, they should certainly produce it for you.
- Say that you know your rights
- Usually the law does not require that you mention the access to information law or freedom of information act, but this is recommended because it shows you know your legal rights and is likely to encourage correct processing of the requests according to the law. We note that for requests to the EU, it’s important to mention that it’s an access to documents request and it’s best to make a specific mention of Regulation 1049/2001.
- Keep it simple
- In all countries, it is better to start with a simple request for information and then to add more questions once you get the initial information. That way you don’t run the risk of the public institution applying an extension because it is a “complex request.”
- Keep it focused
- A request for information only held by one part of a public authority will probably be answered more quickly than one which requires a search across the entire authority. A request which involves the authority in consulting third parties (e.g., a private company which supplied the information, another government which is affected by it) can take a particularly long time. Be persistent.
- Think inside the filing cabinet
- Try to find out what data is collated. For example, if you get a blank copy of the form the police fill out after traffic accidents, you can then see what information they do or do not record about car crashes.
- Be specific
- Before you submit your request, think: is it in any way ambiguous? This is especially important if you are planning to compare data from different public authorities. For example, if you ask for figures for the past three years, some authorities will send you information for the past three calendar years and others for the past three financial years, which you won’t be able to directly compare. If you decide to hide your real request in a more general one, then you should make your request broad enough so that it captures the information you want but not so broad as to be unclear or discourage a response. Specific and clear requests tend to get faster and better answers.
- Submit multiple requests
- If you are unsure where to submit your request, there is nothing to stop you submitting the request with two, three, or more bodies at the same time. In some cases, the various bodies will give you different answers, but this can actually be helpful in giving you a fuller picture of the information available on the subject you are investigating.
- Submit international requests
- Increasingly, requests can be submitted electronically, so it doesn’t matter where you live. Alternatively, if you do not live in the country where you want to submit the request, you can sometimes send the request to the embassy and they should transfer it to the competent public body. You will need to check with the relevant embassy first if they are ready to do this—sometimes the embassy staff will not have been trained in the right to information and if this seems to be the case, it’s safer to submit the request directly to the relevant public body.
- Do a test run
- If you are planning to send the same request to many public authorities, start by sending an initial draft of the request to a few authorities as a pilot exercise. This will show you whether you are using the right terminology to obtain the material you want and whether answering your questions is feasible, so that you can then revise the request if necessary before sending it to everyone.
- Anticipate the exceptions
- If you think that exceptions might be applied to your request, then, when preparing your questions, separate the question about the potentially sensitive information from the other information that common sense would say should not fall under an exception. Then split your question in two and submit the two requests separately.
- Ask for access to the files
- If you live near where the information is held (e.g., in the capital where the documents are kept), you can also ask to inspect original documents. This can be helpful when researching information that might be held in a large number of documents that you’d like to have a look through. Such inspection should be free of charge and should be arranged at a time that is reasonable and convenient for you.
- Keep a record!
- Make your request in writing and save a copy or a record of it so that in the future you are able to demonstrate that your request was sent, in case you need to make an appeal against failure to answer. This also gives you evidence of submitting the request if you are planning to do a story on it.
- Make it public
- Speed up answers by making it public that you submitted a request: if you write or broadcast a story that the request has been submitted, it can put pressure on the public institution to process and respond to the request. You can update the information as and when you get a response to the request—or if the deadline passes and there is no response, you can make this into a news story as well. Doing this has the additional benefit of educating members of the public about the right of access to information and how it works in practice.
Note
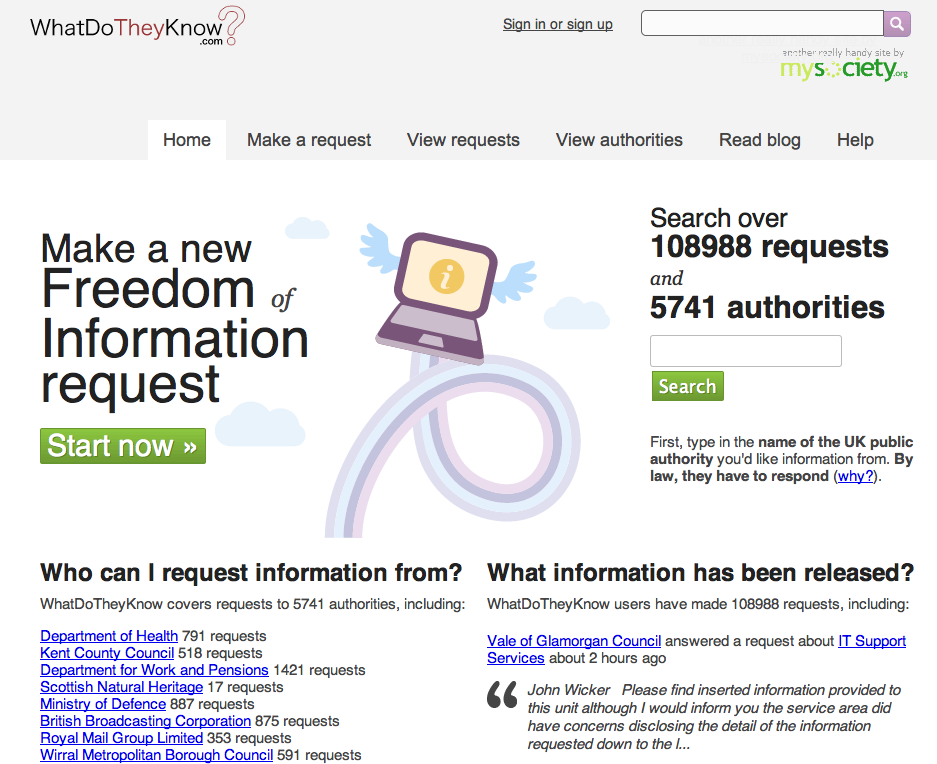
There are also several excellent services which you can use to make your request, and any subsequent responses, publicly viewable on the web, such as What Do They Know? for UK public bodies, Frag den Staat for German public bodies, and Ask the EU for EU institutions. The Alaveteli project is helping to bring similar services to dozens of countries around the world.
- Involve colleagues
- If your colleagues are skeptical about the value of access to information requests, one of the best ways to convince them is to write a story based on information you obtained using an access to information law. Mentioning in the final article or broadcast piece that you used the law is also recommended as a way of enforcing its value and raising public awareness of the right.
- Ask for raw data
- If you want to analyze, explore, or manipulate data using a computer, then you should explicitly ask for data in an electronic, machine-readable format. You may wish to clarify this by specifying, for example, that you require budgetary information in a format “suitable for analysis with accounting software.” You may also wish to explicitly ask for information in disaggregated or granular form. You can read more about this point in this report.
- Asking about organizations exempt from FOI laws
- You may wish to find out about NGOs, private companies, religious organizations, and/or other organizations that are not required to release documents under FOI laws. However, it is possible to find information about them by asking public bodies, which are covered by FOI laws. For example, you could ask a government department or ministry if they have funded or dealt with a specific private company or NGO and request supporting documents. If you need further help with making your FOI request, you can also consult the Legal Leaks toolkit for journalists
— Helen Darbishire (Access Info Europe), Djordje Padejski (Knight Journalism Fellow, Stanford University), Martin Rosenbaum (BBC), and Fabrizio Scrollini (London School of Economics and Political Science)
Using freedom of information legislation—or wobbing, as it is sometimes called—is an excellent tool. But it requires method and, often, persistence. Here are three examples illustrating the strengths and challenges of wobbing from my work as an investigative journalist.
Every year, EU pays almost €60 billion to farmers and the farming industry. Every year. This has been going on since late 1950s and the political narrative was that the subsidies help our poorest farmers. However a first FOI breakthrough in Denmark in 2004 indicated that this was just a narrative. The small farmers were struggling, as they so often complained about in private and in public, and in reality most of the money went to a few large landowners and to the agricultural industry. So obviously I wanted to know: is there a pattern across Europe?
In the summer of 2004, I asked the European Commission for the data. Every year in February, the Commission receives data from the member states. The data shows who applies for EU funding, how much beneficiaries get, and whether they get it for farming their land, developing their region, or for exporting milk powder. At that time, the Commission received the figures as CSV files on a CD. A lot of data, but in principle easy to work with. If you could get it out, that is.
In 2004 the Commission refused to release the data; the key argument was that the data was uploaded into a database and couldn’t be retrieved without a lot of work. An argument that the European Ombudsmand called maladministration. You can find all documents in this case on the wobbing.eu website. Back in 2004, we did not have the time to be legal foodies. We wanted the data.
So we teamed up with partners throughout Europe to get the data country by country. English, Swedish, and Dutch colleagues got the data in 2005. Finland, Poland, Portugal, regions of Spain, Slovenia, and other countries opened up too. Even in wob-difficult Germany I got a breakthrough and received some data in the province of North Rhine-Westfalia in 2007. I had to go to court to get the data—but it resulted in some nice articles in the Stern and Stern online news magazine.
Was it a coincidence that Denmark and the UK were the first to open up their data? Not necessarily. Looking at the bigger political picture, the farm subsidies at the time had to be seen in the context of the WTO negotiations where subsidies were under pressure. Denmark and the UK are amongst the more liberal countries in Europe, so there may well have been political winds blowing into the direction of transparency in those countries.
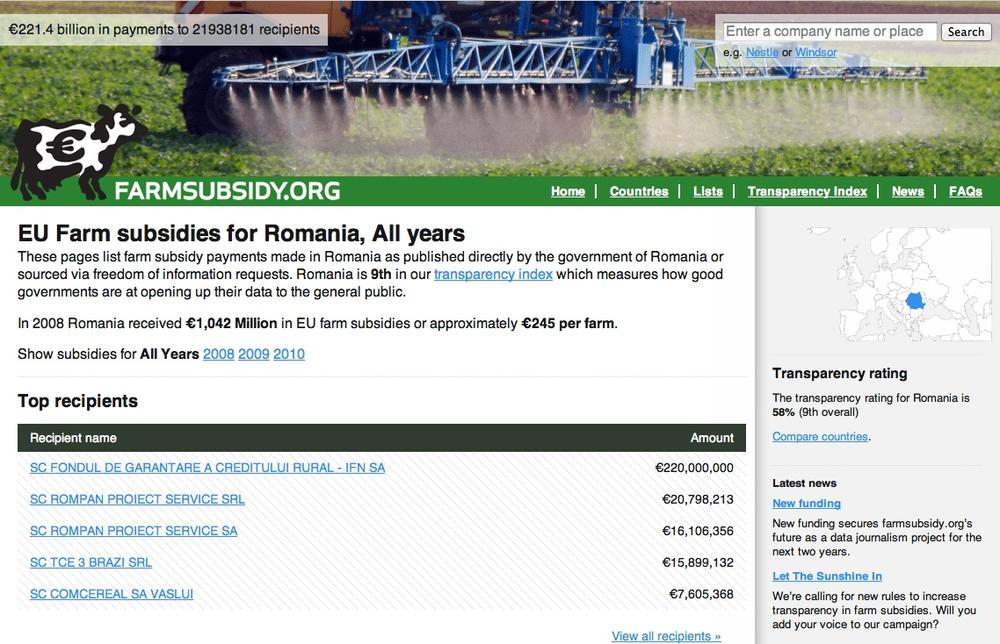
The story did not stop there; for more episodes and for the data, see http://farmsubsidy.org/.
Lesson: go wob-shopping. We have a fabulous diversity of freedom of information laws in Europe, and different countries have different political interests at different times. This can be used to your advantage.
We are all guinea pigs when it comes to taking medicine. Drugs can have side effects. We all know this: we balance potential benefits with potential risks, and we make a decision. Unfortunately, this is not often an informed decision.
When teenagers take a pill against pimples, they hope for smooth skin, not for a bad mood. Yet exactly this happened with one drug, where the youngsters became depressed and even suicidal after taking it. The danger of this particular side effect—an obvious story for journalists—was not easily available.
There is data about side effects. The producers regularly have to deliver information to the health authorities about observed side effects. They are held by national or European authorities once a drug is allowed on the market.
The initial breakthrough again came at the national level in Denmark. During a cross-border research by a Danish-Dutch-Belgian team, the Netherlands opened up too. Another example of wob-shopping: it greatly helped our case to point out to the Dutch authorities that the data was accessible in Denmark.
But the story was true: in Europe there were suicidal young people and sadly also suicides in several countries as a result of the drug. Journalists, researchers, and the family of a young victim were all pushing hard to get access to this information. The European Ombudsman helped to push for the transparency at the European Medicines Agency, and it looks as if he succeeded. So now the task is upon journalists to get out data and analyze the material thoroughly. Are we all guinea pigs, as one researcher put it, or are the control mechanisms sound?
Lessons: don’t take no for an answer when it’s about transparency. Be persistent and follow a story over time. Things may well change and allow better reporting based upon better access at a later point.
Recent history can be utterly painful for entire populations, particularly after wars and in times of transition. So how can journalists obtain hard data to investigate, when—for example—last decade’s war profiteers are now in power? This was the task that a team of Slovenian, Croatian and Bosnian journalists set out to pursue.
The team set out to investigate arms trades in former Yugoslavia during the UN embargo in the early 1990s. The basis of the work was documents from parliamentary inquiries into this subject. In order to document the routes of the shipment and understand the structure of the trading, transports had to be traced by vessel number in ports and license plates of trucks.
Slovenian parliamentary commissions have held inquiries into the question of profiteering from the Balkan wars, but have never reached a conclusion. Yet there was an extremely valuable trail of declassified documents and data, including 6,000 pages which the Slovene team obtained through a freedom of information request.
In this case the data had to be extracted from the documents and sorted in databases. By augmenting the data with further data, analysis, and research, they were able to map numerous routes of the illegal weapon trade.
The team succeeded and the results are unique and have already won the team their first award. Most importantly, the story matters for the entire region and may well be picked up by journalists in other countries through which the deadly cargo has passed.
Lessons: get out good raw material even if you find it in unexpected places and combine it with existing publicly accessible data.
— Brigitte Alfter, Journalismfund.eu
You’ve tried everything else, and you haven’t managed to get your hands on the data you want. You’ve found the data on the Web, but, alas—no download options are available and copy-paste has failed you. Fear not, there may still be a way to get the data out. For example you can:
- Get data from web-based APIs, such as interfaces provided by online databases and many modern web applications (including Twitter, Facebook, and many others). This is a fantastic way to access government or commercial data, as well as data from social media sites.
- Extract data from PDFs. This is very difficult, as PDF is a language for printers and does not retain much information on the structure of the data that is displayed within a document. Extracting information from PDFs is beyond the scope of this book, but there are some tools and tutorials that may help you do it.
- Screen scrape websites. During screen scraping, you’re extracting structured content from a normal web page with the help of a scraping utility or by writing a small piece of code. While this method is very powerful and can be used in many places, it requires a bit of understanding about how the web works.
With all those great technical options, don’t forget the simple options: often it is worth it to spend some time searching for a file with machine-readable data or to call the institution that is holding the data you want.
In this chapter we walk through a very basic example of scraping data from an HTML web page.
The goal for most of these methods is to get access to machine-readable data. Machine-readable data is created for processing by a computer, instead of the presentation to a human user. The structure of such data relates to contained information, and not the way it is displayed eventually. Examples of easily machine-readable formats include CSV, XML, JSON, and Excel files, while formats like Word documents, HTML pages, and PDF files are more concerned with the visual layout of the information. PDF, for example, is a language that talks directly to your printer; it’s concerned with position of lines and dots on a page, rather than distinguishable characters.
Everyone has done this: you go to a website, see an interesting table and try to copy it over to Excel so you can add some numbers up or store it for later. Yet this often does not really work, or the information you want is spread across a large number of websites. Copying by hand can quickly become very tedious, so it makes sense to use a bit of code to do it.
The advantage of scraping is that you can do it with virtually any website, from weather forecasts to government spending, even if that site does not have an API for raw data access.
There are, of course, limits to what can be scraped. Some factors that make it harder to scrape a site include:
- Badly formatted HTML code with little or no structural information (e.g., older government websites).
- Authentication systems that are supposed to prevent automatic access (e.g., CAPTCHA codes and paywalls).
- Session-based systems that use browser cookies to keep track of what the user has been doing.
- A lack of complete item listings and possibilities for wildcard search.
- Blocking of bulk access by the server administrators.
Another set of limitations are legal barriers: some countries recognize database rights, which may limit your right to reuse information that has been published online. Sometimes, you can choose to ignore the license and do it anyway—depending on your jurisdiction, you may have special rights as a journalist. Scraping freely available government data should be fine, but you may wish to double-check before you publish. Commercial organizations—and certain NGOs—react with less tolerance and may try to claim that you’re “sabotaging” their systems. Other information may infringe the privacy of individuals and thereby violate data privacy laws or professional ethics.
There are many programs that can be used to extract bulk information from a web site, including browser extensions and some web services. Depending on your browser, tools like Readability (http://www.readability.com/; which helps extract text from a page) or DownThemAll (http://www.downthemall.net/; which allows you to download many files at once) will help you automate some tedious tasks, while Chrome’s Scraper extension was explicitly built to extract tables from web sites. Developer extensions like FireBug (http://getfirebug.com/; for Firefox—the same thing is already included in Chrome, Safari, and IE) let you track exactly how a website is structured and what communications happen between your browser and the server.
ScraperWiki is a website that allows you to code scrapers in a number of different programming languages, including Python, Ruby, and PHP. If you want to get started with scraping without the hassle of setting up a programming environment on your computer, this is the way to go. Other web services, such as Google Spreadsheets and Yahoo! Pipes, also allow you to perform some extraction from other websites.
Web scrapers are usually small pieces of code written in a programming language such as Python, Ruby, or PHP. Choosing the right language is largely a question of which community you have access to: if there is someone in your newsroom or city already working with one of these languages, then it makes sense to adopt the same language.
While some of the click-and-point scraping tools mentioned before may be helpful to get started, the real complexity involved in scraping a website is in addressing the right pages and the right elements within these pages to extract the desired information. These tasks aren’t about programming, but understanding the structure of the website and database.
When displaying a website, your browser will almost always make use of two technologies: HTTP, to communicate with the server and to request specific resource, such as documents, images or videos; and HTML, the language in which websites are composed.
Any HTML page is structured as a hierarchy of boxes (which are defined by HTML “tags”). A large box will contain many smaller ones—for example, a table that has many smaller divisions: rows and cells. There are many types of tags that perform different functions—some produce boxes—others tables, images, or links. Tags can also have additional properties (e.g., they can be unique identifiers) and can belong to groups called “classes” that make it possible to target and capture individual elements within a document. Selecting the appropriate elements this way and extracting their content is the key to writing a scraper.
Viewing the elements in a web page, everything can be broken up into boxes within boxes.
To scrape web pages, you’ll need to learn a bit about the different types of elements that can be in an HTML document. For example, the <table> element wraps a whole table, which has <tr> (table row) elements for its rows, which in turn contain <td> (table data) for each cell. The most common element type you will encounter is <div>, which can basically mean any block of content. The easiest way to get a feel for these elements is by using the developer toolbar in your browser: they will allow you to hover over any part of a web page and see what the underlying code is.
Tags work like book ends, marking the start and the end of a unit. For example <em> signifies the start of an italicized or emphasized piece of text and </em> signifies the end of that section. Easy.
NEWS is the International Atomic Energy Agency’s (IAEA) portal on worldwide radiation incidents (and a strong contender for membership in the Weird Title Club!). The web page lists incidents in a simple, blog-like site that can be easily scraped.
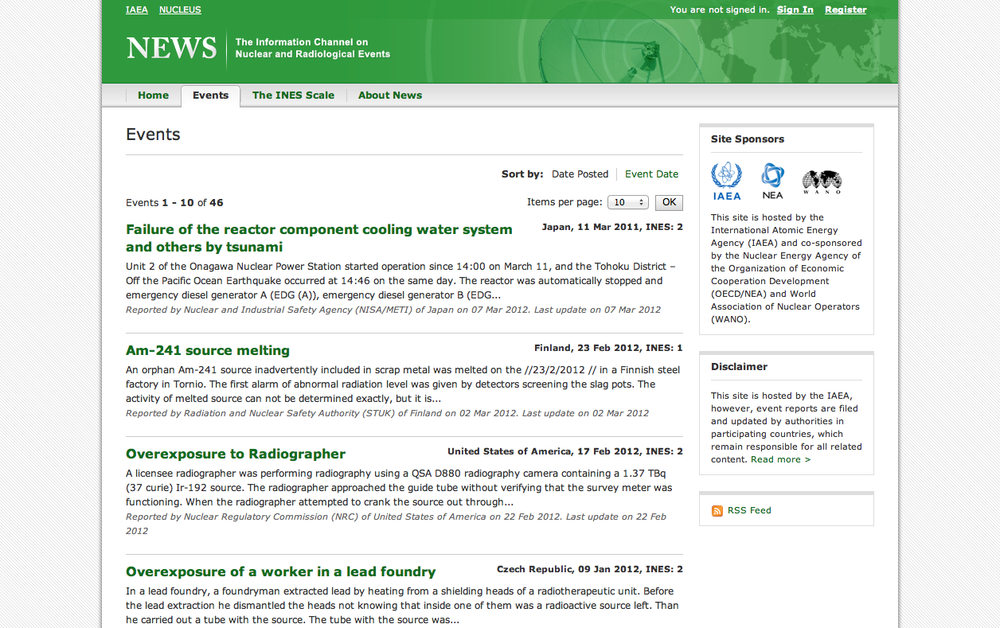
To start, create a new Python scraper on ScraperWiki and you will be presented with a text area that is mostly empty, except for some scaffolding code. In another browser window, open the IAEA site and open the developer toolbar in your browser. In the “Elements” view, try to find the HTML element for one of the news item titles. Your browser’s developer toolbar helps you connect elements on the web page with the underlying HTML code.
Investigating this page will reveal that the titles are <h4> elements within a <table>. Each event is a <tr> row, which also contains a description and a date. If we want to extract the titles of all events, we should find a way to select each row in the table sequentially, while fetching all the text within the title elements.
In order to turn this process into code, we need to make ourselves aware of all the steps involved. To get a feeling for the kind of steps required, let’s play a simple game: in your ScraperWiki window, try to write up individual instructions for yourself, for each thing you are going to do while writing this scraper, like steps in a recipe (prefix each line with a hash sign to tell Python that this not real computer code). For example:
# Look for all rows in the table
# Unicorn must not overflow on left side.
Try to be as precise as you can and don’t assume that the program knows anything about the page you’re attempting to scrape.
Once you’ve written down some pseudo-code, let’s compare this to the essential code for our first scraper:
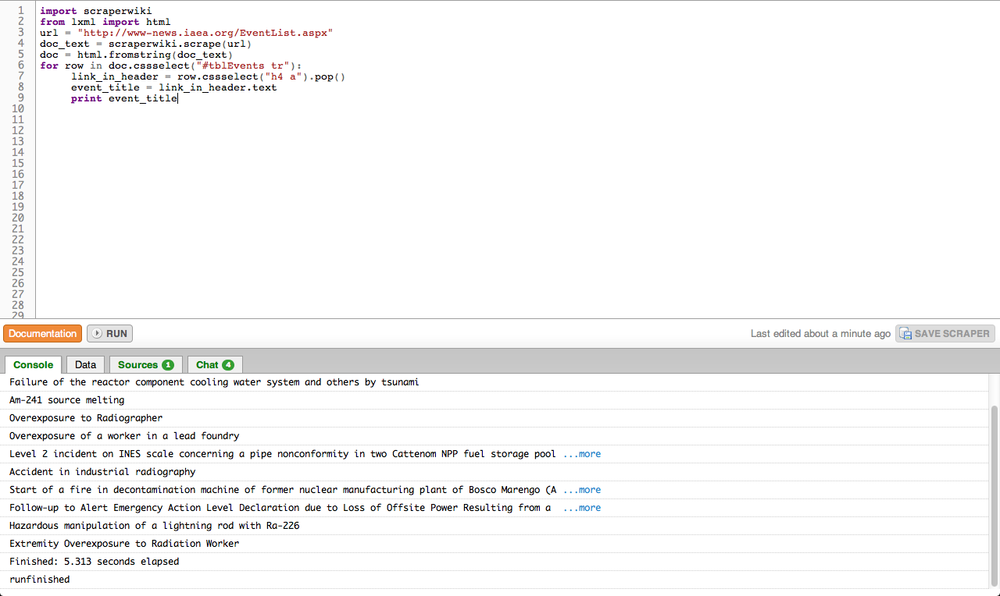
import scraperwiki
from lxml import html
In this first section, we’re importing existing functionality from libraries—snippets of pre-written code. scraperwiki will give us the ability to download websites, while lxml is a tool for the structured analysis of HTML documents. Good news: if you are writing a Python scraper with ScraperWiki, these two lines will always be the same.
url = "http://www-news.iaea.org/EventList.aspx"
doc_text = scraperwiki.scrape(url)
doc = html.fromstring(doc_text)
Next, the code makes a name (variable): url, and assigns the URL of the IAEA page as its value. This tells the scraper that this thing exists and we want to pay attention to it. Note that the URL itself is in quotes as it is not part of the program code but a string, a sequence of characters.
We then use the url variable as input to a function, scraperwiki.scrape. A function will provide some defined job—in this case, it’ll download a web page. When it’s finished, it’ll assign its output to another variable, doc_text. doc_text will now hold the actual text of the website; not the visual form you see in your browser, but the source code, including all the tags. Since this form is not very easy to parse, we’ll use another function, html.fromstring, to generate a special representation where we can easily address elements, the so-called document object model (DOM).
for row in doc.cssselect("#tblEvents tr"):
link_in_header = row.cssselect("h4 a").pop()
event_title = link_in_header.text
print event_title
In this final step, we use the DOM to find each row in our table and extract the event’s title from its header. Two new concepts are used: the for loop and element selection (.cssselect). The for loop essentially does what its name implies; it will traverse a list of items, assigning each a temporary alias (row in this case) and then run any indented instructions for each item.
The other new concept, element selection, is making use of a special language to find elements in the document. CSS selectors are normally used to add layout information to HTML elements and can be used to precisely pick an element out of a page. In this case (line 6) we’re selecting #tblEvents tr, which will match each <tr> within the table element with the ID tblEvents (the hash simply signifies ID). Note that this will return a list of <tr> elements.
That can be seen on the next line (line 7), where we’re applying another selector to find any <a> (which is a hyperlink) within a <h4> (a title). Here we only want to look at a single element (there’s just one title per row), so we have to pop it off the top of the list returned by our selector with the .pop() function.
Note that some elements in the DOM contain actual text (i.e., text that is not part of any markup language), which we can access using the [element].text syntax seen on line 8. Finally, in line 9, we’re printing that text to the ScraperWiki console. If you hit run in your scraper, the smaller window should now start listing the event’s names from the IAEA website.
You can now see a basic scraper operating: it downloads the web page, transforms it into the DOM form, and then allows you to pick and extract certain content. Given this skeleton, you can try and solve some of the remaining problems using the ScraperWiki and Python documentation:
- Can you find the address for the link in each event’s title?
- Can you select the small box that contains the date and place by using its CSS class name and extract the element’s text?
- ScraperWiki offers a small database to each scraper so you can store the results; copy the relevant example from their docs and adapt it so it will save the event titles, links and dates.
- The event list has many pages; can you scrape multiple pages to get historic events as well?
As you’re trying to solve these challenges, have a look around ScraperWiki: there are many useful examples in the existing scrapers; quite often, the data is pretty exciting, too. This way, you don’t need to start off your scraper from scratch: just choose one that is similar, fork it, and adapt it to your problem.
— Friedrich Lindenberg, Open Knowledge Foundation
How can you find out more about something that only exists on the Internet? Whether you’re looking at an email address, website, image, or Wikipedia article, in this chapter I’ll take you through the tools that will tell you more about their backgrounds.
First, a few different services you can use to discover more about an entire site, rather than a particular page:
- Whois
- If you go to http://whois.domaintools.com/ (or just type whois www.example.com in Terminal.app on a Mac, with a URL in place of the placeholder here) you can get the basic registration information for any website. In recent years, some owners have chosen private registration, which hides their details from view, but in many cases you’ll see a name, address, email, and phone number for the person who registered the site. You can also enter numerical IP addresses here and get data on the organization or individual that owns that server. This is especially handy when you’re trying to track down more information on an abusive or malicious user of a service, since most websites record an IP address for everyone who accesses them.
- Blekko
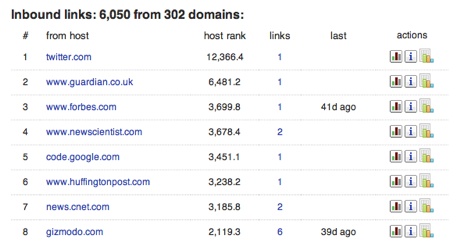
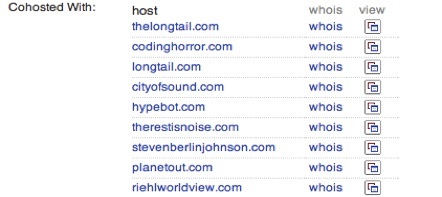
- The Blekko search engine offers an unusual amount of insight into the internal statistics it gathers on sites as it crawls the Web. If you type in a domain name followed by “/seo”, you’ll receive a page of information on that URL. The first tab in Figure 4-7 shows you which other sites are linking to the domain in popularity order. This can be extremely useful when you’re trying to understand what coverage a site is receiving, and if you want to understand why it’s ranking highly in Google’s search results, since they’re based on those inbound links. Figure 4-8 tells you which other websites are running from the same machine. It’s common for scammers and spammers to astroturf their way towards legitimacy by building multiple sites that review and link to each other. They look like independent domains, and may even have different registration details, but they’ll often actually live on the same server because that’s a lot cheaper. These statistics give you an insight into the hidden business structure of the site you’re researching.

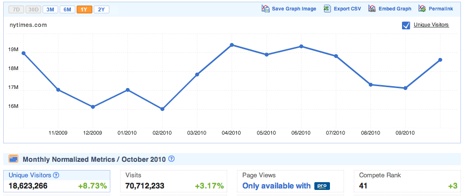
- Compete.com
- By surveying a cross-section of American consumers, http://www.compete.com/ builds up detailed usage statistics for most websites, and makes some basic details freely available. Choose the Site Profile tab and enter a domain (Figure 4-9). You’ll then see a graph of the site’s traffic over the last year, together with figures for how many people visited, and how often (as in Figure 4-10). Since they’re based on surveys, the numbers are only approximate, but I’ve found them reasonably accurate when I’ve been able to compare them against internal analytics. In particular, they seem to be a good source when comparing two sites, since while the absolute numbers may be off for both, it’s still a good representation of their relative difference in popularity. They only survey US consumers though, so the data will be poor for predominantly international sites.
- Google’s Site Search
- One feature that can be extremely useful when you’re trying to explore all the content on a particular domain is the “site:” keyword. If you add “site:example.com” to your search phrase, Google will only return results from the site you’ve specified. You can even narrow it down further by including the prefix of the pages you’re interested in, for example, “site:example.com/pages/”, and you’ll only see results that match that pattern. This can be extremely useful when you’re trying to find information that domain owners may have made publicly available but aren’t keen to publicize, so picking the right keywords can uncover some very revealing material.
Sometimes you’re interested in the activity that’s surrounding a particular story, rather than an entire website. The tools below give you different angles on how people are reading, responding to, copying, and sharing content on the web.
- Bit.ly
- I always turn to bit.ly when I want to know how people are sharing a particular link with each other. To use it, enter the URL you’re interested in. Then click on the Info Page+ link. That takes you to the full statistics page (though you may need to choose “aggregrate bit.ly link” first if you’re signed in to the service). This will give you an idea of how popular the page is, including activity on Facebook and Twitter, and below that you’ll see public conversations about the link provided by backtype.com. I find this combination of traffic data and conversations very helpful when I’m trying to understand why a site or page is popular, and who exactly its fans are. For example, it provided me with strong evidence that the prevailing narrative about grassroots sharing and Sarah Palin was wrong.
- As the micro-blogging service becomes more widely used, it becomes more useful as a gauge of how people are sharing and talking about individual pieces of content. It’s deceptively simple to discover public conversations about a link. You just paste the URL you’re interested in into the search box, and then possibly hit “more tweets” to see the full set of results.
- Google’s Cache
- When a page becomes controversial, the publishers may take it down or alter it without acknowledgment. If you suspect you’re running into the problem, the first place to turn is Google’s cache of the page as it was when it did its last crawl. The frequency of crawls is constantly increasing, so you’ll have the most luck if you try this within a few hours of the suspected changes. Enter the target URL in Google’s search box, and then click the triple arrow on the right of the result for that page. A graphical preview should appear, and if you’re lucky, there will be a small “Cache” link at the top of it. Click that to see Google’s snapshot of the page. If that has trouble loading, you can switch over to the more primitive text-only page by clicking another link at the top of the full cache page. You’ll want to take a screenshot or copy-paste any relevant content you do find, since it may be invalidated at any time by a subsequent crawl.
- The Internet Archive’s Wayback Machine
- If you need to know how a particular page has changed over a longer time period, like months or years, the Internet Archive runs a service called The Wayback Machine that periodically takes snapshots of the most popular pages on the web. You go to the site, enter the link you want to research, and if it has any copies, it will show you a calendar so you can pick the time you’d like to examine. It will then present a version of the page roughly as it was at that point. It will often be missing styling or images, but it’s usually enough to understand what the focus of that page’s content was then.
- View Source
- It’s a bit of a long shot, but developers often leave comments or other clues in the HTML code that underlies any page. It will be on different menus depending on your browser, but there’s always a “View source” option that will let you browse the raw HTML. You don’t need to understand what the machine-readable parts mean, just keep an eye out for the pieces of text that are often scattered amongst them. Even if they’re just copyright notices or mentions of the author’s names, these can often give important clues about the creation and purpose of the page.
- TinEye
- Sometimes you really want to know the source of an image, but without clear attribution text there’s no obvious way to do this with traditional search engines like Google. TinEye offers a specialized “reverse image search” process, where you give it the image you have, and it finds other pictures on the web that look very similar. Because they use image recognition to do the matching, it even works when a copy has been cropped, distorted, or compressed. This can be extremely effective when you suspect that an image that’s being passed off as original or new is being misrepresented, since it can lead back to the actual source.
- YouTube
- If you click on the Statistics icon to the lower right of any video, you can get a rich set of information about its audience over time. While it’s not complete, it is useful for understanding roughly who the viewers are, where they are coming from, and when.
If you have some emails that you’re researching, you’ll often want to know more details about the sender’s identity and location. There isn’t a good off-the-shelf tool available to help with this, but it can be very helpful to know the basics about the hidden headers included in every email message. These work like postmarks, and can reveal a surprising amount about the sender. In particular, they often include the IP address of the machine that the email was sent from, a lot like caller ID on a phone call. You can then run whois on that IP number to find out which organization owns that machine. If it turns out to be someone like Comcast or AT&T who provide connections to consumers, then you can visit MaxMind to get its approximate location.
To view these headers in Gmail, open the message and open the menu next to reply on the top right and choose “Show original”.
You’ll then see a new page revealing the hidden content. There will be a couple of dozen lines at the start that are words followed by a colon. The IP address you’re after may be in one of these, but its name will depend on how the email was sent. If it was from Hotmail, it will be called X-Originating-IP:, but if it’s from Outlook or Yahoo it will be in the first line starting with Received:.
Running the address through Whois tells me it’s assigned to Virgin Media, an ISP in the UK, so I put it through MaxMind’s geolocation service to discover it’s coming from my home town of Cambridge. That means I can be reasonably confident this is actually my parents emailing me, not impostors!
If you’re digging into a broad topic rather than a particular site or item, here’s a couple of tools that can give you some insight:
- Wikipedia Article Traffic
- If you’re interested in knowing how public interest in a topic or person has varied over time, you can actually get day-by-day viewing figures for any page on Wikipedia at http://stats.grok.se/. This site is a bit rough and ready, but will let you uncover the information you need with a bit of digging. Enter the name you’re interested in to get a monthly view of the traffic on that page. That will bring up a graph showing how many times the page was viewed for each day in the month you specify. Unfortunately you can only see one month at a time, so you’ll have to select a new month and search again to see longer-term changes.
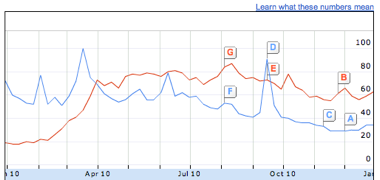
- Google Insights
- You can get a clear view into the public’s search habits using Insights from Google (http://www.google.com/insights/search/; Figure 4-11). Enter a couple of common search phrases, like “Justin Bieber vs Lady Gaga”, and you’ll see a graph of their relative number of searches over time. There’s a lot of options for refining your view of the data, from narrower geographic areas, to more detail over time. The only disappointment is the lack of absolute values—you only get relative percentages, which can be hard to interpret.
— Pete Warden, independent data analyst and developer
Crowdsourcing, according to Wikipedia, is “a distributed problem-solving and production process that involves outsourcing tasks to a network of people, also known as the crowd.” The following is from an interview with Simon Rogers on how the Datablog used crowdsourcing to cover the MPs’ expenses scandal, drug use, and the Sarah Palin papers:
Sometimes you will get a ton of files, statistics, or reports which it is impossible for one person to go through. Also you may get hold of material that is inaccessible or in a bad format and you aren’t able to do much with it. This is where crowdsourcing can help.
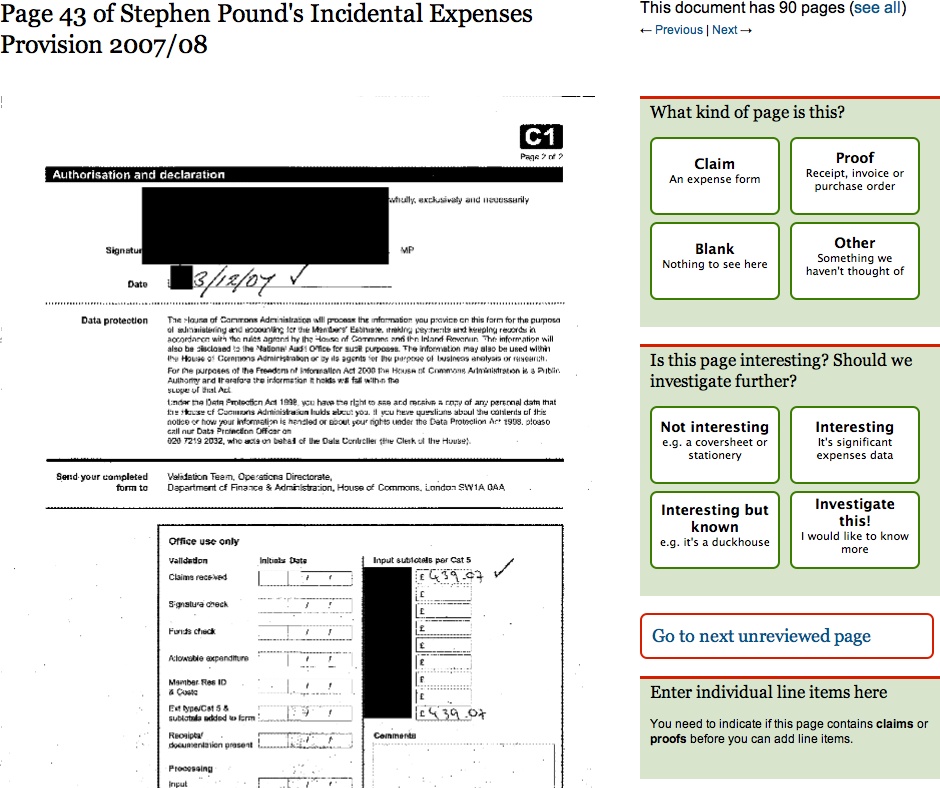
One thing the Guardian has got is lots of readers, lots of pairs of eyes. If there is an interesting project where we need input, then we can ask them to help us. That is what we did with the MPs’ Expenses. We had 450,000 documents and very little time to do anything. So what better way than open up the task to our readership?
The MPs’ Expenses project generated lots of tip-offs. We got more stories than data. The project was remarkably successful in terms of traffic. People really liked it.
We are currently doing something with MixMag on drug use, which has been phenomenal as well. It looks like it is going to be bigger than the British crime survey in terms of how many people come back to it, which is brilliant.
What both of these projects have in common is that they are about issues that people really care about, so they are willing to spend time on them. A lot of the crowdsourcing we have done relies on help from obsessives. With the MPs’ expenses, we had a massive amount of traffic at the beginning and it really died down. But we still have people that are obsessively going through every page looking for anomalies and stories. One person has done 30,000 pages. They know a lot of stuff.
We also used crowdsourcing with the Sarah Palin papers. Again this was a great help in scouring the raw information for stories.
In terms of generating stories crowdsourcing has worked really well for us. People really liked it and it made the Guardian look good. But in terms of generating data, we haven’t used crowdsourcing so much.
Some of the crowdsourcing projects that we’ve done that have worked really well have been more like old-fashioned surveys. When you are asking people about their experience, about their lives, about what they’ve done, they work very well because people aren’t as likely to make that up. They will say what they feel. When we asked people to kind of do our job for us, you have to find a framework for people to produce the data in a way you can trust them.
Regarding the reliability of data, I think the approach that Old Weather have got is really good. They get ten people to do each entry, which is a good way to ensure accuracy. With the MPs’ expenses, we tried to minimize the risk of MPs going online and editing their own records to make themselves look better. But you can’t permanently guard against this. You can only really look out for certain URLs or if it’s coming from the SW1 area of London. So that’s a bit trickier. The data we were getting out was not always reliable. Even though stories were great, it wasn’t producing raw numbers that we could confidently use.
If I were to give advice to aspiring data journalists who want to use crowdsourcing to collect data, I would encourage them do this on something that people really care about, and will continue to care about when it stops making front page headlines. Also if you make something more like a game, this can really help to engage people. When we did the expenses story a second time, it was much more like a game with individual tasks for people to do. It really helped to give people specific tasks. That made a big difference because I think if you just present people with the mountain of information to go through and say “go through this,” it can make for hard and rather unrewarding work. So I think making it fun is really important.
— Marianne Bouchart, Data Journalism Blog, interviewing Simon Rogers, the Guardian
I think the crowdsourcing project that got the biggest response was a piece on the Olympic ticket ballot. Thousands of people in the UK tried to get tickets for the 2012 Olympics and there was a lot of fury that people hadn’t received them. People had ordered hundreds of pounds worth and were told that they’d get nothing. But no one really knew if it was just some people complaining quite loudly while actually most people were happy. So we tried to work out a way to find out.
We decided the best thing we could really do, with the absence of any good data on the topic, was to ask people. And we thought we’d have to treat it as a light thing because it wasn’t a balanced sample.
We created a Google form and asked very specific questions. It was actually a long form: it asked how much in value people had ordered their tickets, how much their card had been debited for, which events they went for, this kind of thing.
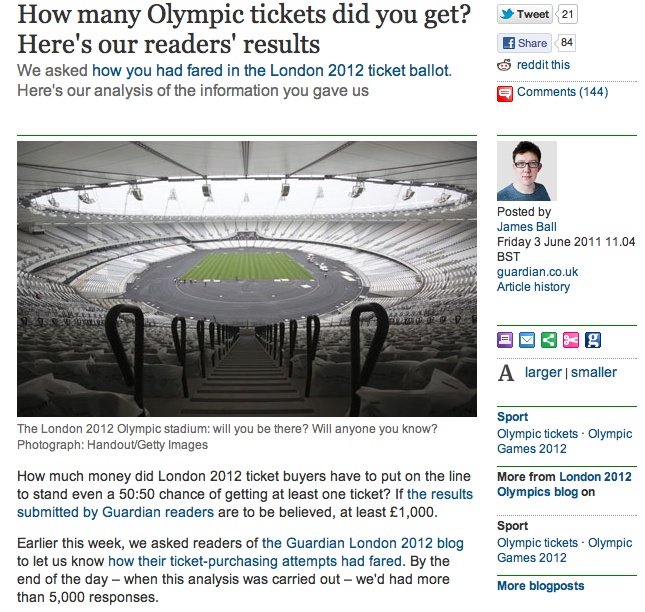
We put it up as a small picture on the front of the site and it was shared around really rapidly. I think this is one of the key things; you can’t just think “What do I want to know for my story?”, you have to think “What do people want to tell me right now?” And it’s only when you tap into what people want to talk about that crowdsourcing is going to be successful. The volume of responses for this project, which is one of our first attempts at crowdsourcing, was huge. We had a thousand responses in less than an hour and seven thousand by the end of that day.
So obviously, we took presenting the results a bit more seriously at this point. Initially, we had no idea how well it would do. So we added some caveats: Guardian readers may be more wealthy than other people, people who got less than they expected might be more willing to talk to us, and so on.
We didn’t know how much value the results would have. We ended up having a good seven thousand records to base our piece on, and we found that about half the people who’d asked for tickets had got nothing. We ran all of this stuff and because so many people had taken part the day before, there was a lot of interest in the results.
A few weeks later, the official summary report came out, and our numbers were shockingly close. They were almost exactly spot-on. I think partly through luck, but also because we got just so many people to respond.
If you start asking your readers about something like this on a comments thread, you will be limited in what you can do with the results. So you have to start by thinking, “What is the best tool for what I want to know?” Is it a comment thread? Or is it building an app? And if it is building an app, you have to think “Is this worth the wait? And is it worth the resources that are required to do it?”
In this case, we thought of Google Forms. If someone fills in the form, you can see the result as a row on a spreadsheet. This meant that even if it was still updating, even if results were still coming in, I could open up the spreadsheet and see all of the results straight away.
I could have tried to do the work in Google, but I downloaded it into Microsoft Excel and then did things like sort it from low to high; I also found the entries where people had written out numbers (instead of putting digits) for how much they spent, and fixed all of those. I decided to exclude as little as I could. So rather than taking only valid responses, I tried to fix what I had. Some people had used foreign currencies, so I converted them to sterling, all of which was a bit painstaking.
But the whole analysis was done in a few hours, and I knocked out the obviously silly entries. A lot of people decided to point out that they spent nothing on tickets. That’s a bit facetious, but fine. That was less than a hundred out of over seven thousand entries.
Then there were a few dozen who put in obviously fake high amounts to try to distort the results. Things like ten million pounds. So that left me with a set that I could use with the normal data principles we use every day. I did what’s called a “pivot table.” I did some averaging. That kind of thing.
We didn’t have any idea how much momentum the project would have, so it was just me working with the Sports blog editor. We put our heads together and thought this might be a fun project. We did it, start to finish, in 24 hours. We had the idea, we put something up at lunchtime, we put it on the front of the site, we saw it was proving quite popular, we kept it on the front of the site for the rest of the day, and we presented the results online the next morning.
We decided to use Google Docs because it gives complete control over the results. I didn’t have to use anyone else’s analytic tools. I can put it easily into a database software or into spreadsheets. When you start using specialist polling software, you are often restricted to using their tools. If the information we’d been asking for was particularly sensitive, we might have hesitated before using Google and thought about doing something “in-house.” But generally, it is very easy to drop a Google Form into a Guardian page and it’s virtually invisible to the user that we are using one. So it is very convenient.
In terms of advice for data journalists who want to use crowdsourcing, you have to have very specific things you want to know. Ask things that get multiple choice responses as much as possible. Try to get some basic demographics of who you are talking to so you can see if your sample might be biased. If you are asking for amounts and things like this, try in the guidance to specify that it’s in digits, that they have to use a specific currency, and things like that. A lot won’t, but the more you hold their hand throughout, the better. And always, always, add a comment box because a lot of people will fill out the other fields but what they really want is to give you their opinion on the story. Especially on a consumer story or an outrage.
— Marianne Bouchart, Data Journalism Blog, interviewing James Ball, the Guardian
In this section we’ll have a quick look at the state of the law with respect to data and databases, and what you can do to open up your data using readily available public licenses and legal tools. Don’t let any of the following dampen your enthusiasm for data-driven journalism. Legal restrictions on data usually won’t get in your way, and you can easily make sure they won’t get in the way of others using data you’ve published.
To state the obvious, obtaining data has never been easier. Before the widespread publishing of data on the Web, even if you had identified a dataset you needed, you’d need to ask whoever had a copy to make it accessible to you, possibly involving paper and the post or a personal visit. Now, you have your computer ask their computer to send a copy to your computer. Conceptually similar, but you have a copy right now, and they (the creator or publisher) haven’t done anything, and probably have no idea that you have downloaded a copy.
What about downloading data with a program (sometimes called “scraping”) and terms of service (ToS)? Consider the previous paragraph: your browser is just such a program. Might ToS permit access by only certain kinds of programs? If you have inordinate amounts of time and money to spend reading such documents and perhaps asking a lawyer for advice, by all means, do. But usually, just don’t be a jerk: if your program hammers a site, your network may well get blocked from accessing the site in question—and perhaps you will have deserved it. There is now a large body of practice around accessing and scraping data from the web. If you plan to do this, reading about examples at a site like ScraperWiki will give you a head start.
Once you have some data of interest, you can query, pore over, sort, visualize, correlate, and perform any other kind of analysis you like using your copy of the data. You can publish your analysis, which can cite any data. There’s a lot to the catchphrase “facts are free” (as in free speech), but maybe this is only a catchphrase among those who think too much about the legalities of databases, or even more broadly (and more wonkily), data governance.
What if, being a good or aspiring-to-be-good data-driven journalist, you intend to publish not just your analysis, including some facts or data points, but also the datasets/databases you used—and perhaps added to—in conducting your analysis? Or maybe you’re just curating data and haven’t done any analysis (good: the world needs data curators). If you’re using data collected by some other entity, there could be a hitch. (If your database is wholly assembled by you, read the next paragraph anyway as motivation for the sharing practices in the next next paragraph.)
If you’re familiar with how copyright restricts creative works—if the copyright holder hasn’t given permission to use a work (or the work is in the public domain or your use might be covered by exceptions and limitations such as fair use) and you use—distribute, perform, etc.—the work anyway, the copyright holder could force you to stop. Although facts are free, collections of facts can be restricted very similarly, though there’s more variation in the relevant laws than there is for copyright as applied to creative works. Briefly, a database can be subject to copyright, as a creative work. In many jurisdictions, by the “sweat of the brow,” merely assembling a database, even in an uncreative fashion, makes the database subject to copyright. In the United States in particular, there tends to be a higher minimum of creativity for copyright to apply (Feist v. Rural, a case about a phone book, is the U.S. classic if you want to look it up). But in some jurisdictions there are also “database rights” that restrict databases, separate from copyright (though there is lots of overlap in terms of what is covered, in particular where creativity thresholds for copyright are nearly nonexistent). The best known of such are the European Union’s sui generis database rights. Again, especially if you’re in Europe, you may want to make sure you have permission before publishing a database from some other entity.
Obviously such restrictions aren’t the best way to grow an ecosystem of data-driven journalism (nor are they good for society at large—social scientists and others told the EU they wouldn’t be before sui generis came about, and studies since have shown them to be right). Fortunately, as a publisher of a database, you can remove such restrictions from the database (assuming it doesn’t have elements that you don’t have permission to grant further permissions around), essentially by granting permission in advance. You can do this by releasing your database under a public license or public domain dedication—just as many programmers release their code under a free and open source license, so that others can build on their code (as data-driven journalism often involves code, not just data, of course you should release your code too, so that your data collection and analysis are reproducible). There are lots of reasons for opening up your data. For example, your audience might create new visualizations or applications with it that you can link to—as the Guardian does with their data visualization Flickr pool. Your datasets can be combined with other datasets to give you and your readers greater insight into a topic. Things that others do with your data might give you leads for new stories, or ideas for stories, or ideas for other data-driven projects. And they will certainly bring you kudos.
When one realizes that releasing works under public licenses is a necessity, the question becomes, which license? That tricky question will frequently be answered by the project or community whose work you’re building on, or that you hope to contribute your work to—use the license they use. If you need to dig deeper, start from the set of licenses that are free and open—meaning that anyone has permission, for any use (attribution and sharing alike might be required). What the Free Software Definition and Open Source Definition do for software, the Open Knowledge Definition does for all other knowledge, including databases: define what makes a work open, and what open licenses allow users to do.
You can visit the Open Knowledge Definition website to see the current set of licenses which qualify. In summary, there are basically three classes of open licenses:
- Public domain dedications
- These also serve as maximally permissive licenses; there are no conditions put upon using the work.
- Permissive or attribution-only licenses
- Giving credit is the only substantial condition of these licenses.
- Copyleft, reciprocal, or share-alike licenses
- These also require that modified works, if published, be shared under the same license.
Note if you’re using a dataset published by someone else under an open license, consider the above paragraph a very brief guide as to how to fulfill the conditions of that open license. The licenses you’re most likely to encounter, from Creative Commons, Open Data Commons, and various governments, usually feature a summary that will easily allow you to see what the substantial conditions are. Typically the license will be noted on a web page from which a dataset may be downloaded (or “scraped”, as of course, web pages can contain datasets) or in a conspicuous place within the dataset itself, depending on format. This marking is what you should do as well, when you open up your datasets.
Going back to the beginning, what if the dataset you need to obtain is still not available online, or behind a some kind of access control? Consider, in addition to asking for access yourself, requesting that the data to be opened up for the world to reuse. You could give some pointers to some of the great things that can happen with their data if they do this.
Sharing with the world might bring to mind that privacy and other considerations and regulations might come into play for some datasets. Indeed, just because open data lowers many technical and copyright and copyright-like barriers, doesn’t mean you don’t have to follow other applicable laws. But that’s as it always was, and there are tremendous resources and sometimes protections for journalists should your common sense indicate a need to investigate those.
Good luck! But in all probability you’ll need more of it for other areas of your project than you’ll need for managing the (low) legal risks.
— Mike Linksvayer, Creative Commons
Get The Data Journalism Handbook now with the O’Reilly learning platform.
O’Reilly members experience books, live events, courses curated by job role, and more from O’Reilly and nearly 200 top publishers.

