THIS STOCK MARKET IS NOT GOING DOWN TO ZERO
When we looked at a weekly chart of S&P earlier (p.260-261), we saw that when the weekly NH-NL fell below minus 4,000, it provided strong buy signals. Here (Fig. 10.1), those signals are marked with vertical green lines on this chart. You may notice that while the first of these lines preceded quite a substantial rally, the last two led to brief and fairly weak advances. This indicated that the bears were growing stronger and the bulls weaker.
Occasionally, a decline would carry the weekly NH-NL below minus 4,000, but in the entire history of the U.S. stock market, this indicator has never fallen below minus 6,000. Then, in October 2008, the unprecedented happened—the weekly NH-NL crashed to minus 18,000.
This downspike reflected an absolutely wild level of panic. Bear Stearns ceased to exist, sold for a price below the value of its downtown headquarters. As Lehman Brothers was forced into liquidation, the most often heard words on Wall Street became “counterparty risk.” Institutions were afraid to trade with each other for fear that the other party would not be able to deliver on its obligations.
Figure 10.1 S&P Groping for a Bottom in 2009
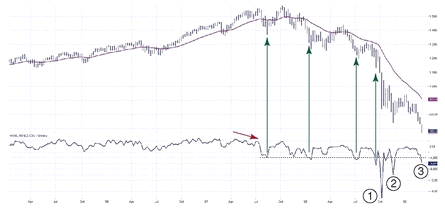
S&P weekly with a 26-week EMA Weekly New High-New Low Index
In this atmosphere, the federal government stepped in. It saved the day by reliquefying the system—pouring a major amount of money ...
Get The New Sell and Sell Short: How to Take Profits, Cut Losses, and Benefit from Price Declines, Expanded Second Edition now with the O’Reilly learning platform.
O’Reilly members experience books, live events, courses curated by job role, and more from O’Reilly and nearly 200 top publishers.

