A DISCRETIONARY EXIT FROM A LONG-TERM TRADE
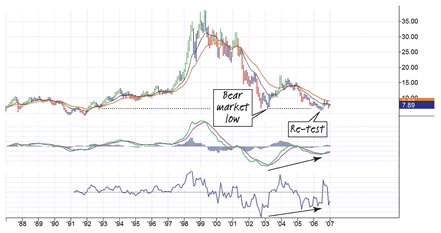
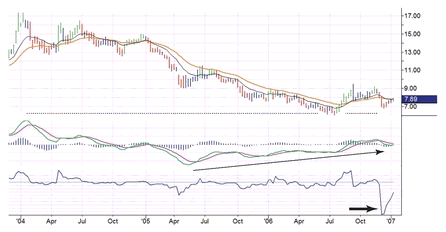
In January 2007 I received an e-mail from a friend who told me about his great bullishness on Ford Motor Company. The firm had just indicated it was likely to announce its biggest quarterly loss in the company’s history, but my friend Gerard de Bruin outlined his reasons why the new CEO would turn the company around. He was a retired money manager whose approach to finding stocks was based on the fundamentals. I respected his judgment and took a look at the stock (see Figures 6.5 and 6.6).
Figure 6.5 F monthly
077
A quick look at a 20-year long monthly chart of Ford revealed a bull market top near $40, followed by a vicious bear market, which took the stock down to $6 in 2003. Ford bounced, then slowly slid to a slightly lower low in 2006. I love this pattern of a slightly lower low, accompanied by massive bullish divergences. With the company prospects very appealing, according to my fundamentalist friend, and a monthly chart very constructive, it was time to look at a weekly chart.7
Figure 6.6 F weekly
078
The weekly chart confirmed multiple bullish divergences at the 2006 bottom and added another strong buy signal—a deep spike of the weekly Force Index, marked by an arrow on the chart. Such a downspike reflects a huge volume of sales, ...

Get The New Sell and Sell Short: How to Take Profits, Cut Losses, and Benefit from Price Declines, Expanded Second Edition now with the O’Reilly learning platform.

O’Reilly members experience books, live events, courses curated by job role, and more from O’Reilly and nearly 200 top publishers.