NIC’S STOP—TIGHTER BY A DAY
In a Traders’ Camp in 2003, I met a trader by the name of Nic Grove. His story, is in some way typical of how people come to trading. As a young man growing up in Australia, Nic was involved in his family’s real estate business, then went out on his own as a commercial landscaper. By the time he turned 50, he grew tired of the routine and sold his business. He flew to Paris, rented a small apartment, and started learning French. Looking for something to do and generate income, Nic stumbled into trading. He happened to read my book, came to a Camp, and gradually we became good friends.
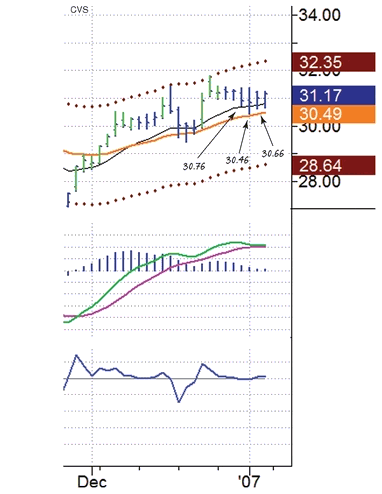
Figure 5.7 CVS daily
058
CVS is in an uptrend on the weekly chart (not shown). This daily chart shows that it has declined into its value zone between the two EMAs. The lowest low of the decline was $30.46, bracketed by two higher lows, $30.76 and $30.66. If we go long CVS, Nic’s stop would belong slightly below the lower of those two bracketing lows. Since the lowest of them was $30.66, I would put a stop at $30.64 or even $30.59—on the other side of a round number.
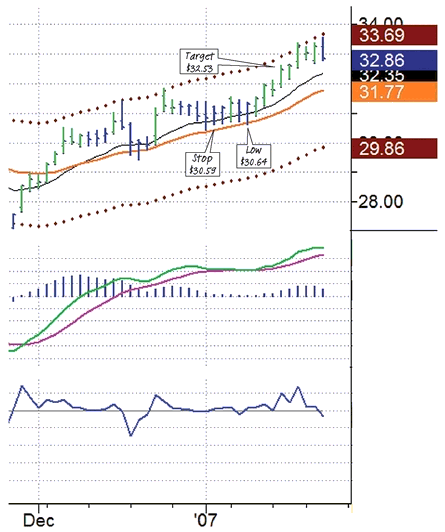
Figure 5.8 CVS daily follow-up
059
CVS hung around its value zone for a few more days before it took off and hit the target at the upper channel line. The stop below the second lowest low was never endangered. ...

Get The New Sell and Sell Short: How to Take Profits, Cut Losses, and Benefit from Price Declines, Expanded Second Edition now with the O’Reilly learning platform.

O’Reilly members experience books, live events, courses curated by job role, and more from O’Reilly and nearly 200 top publishers.