Chapter 4. Let’s Talk Solutions
Concerns about web performance aren’t new. Let’s jump into the Wayback Machine and make a quick visit to 1999, when Zona released a report1 warning online retailers that they risked losing $4.35 billion per year if they didn’t optimize their websites’ loading times. (Interesting aside: Zona recommended that the optimal loading time for ecommerce sites was 8 seconds. Times sure have changed. Today, we know that for most ecommerce sites, the performance sweet spot is around 2.5 seconds. After 4 seconds, conversion rates dip sharply.)
Over the years, solutions have become increasingly refined, from building out the bulk of the infrastructure of the Internet to homing in on performance issues within the browser. This chapter offers a quick fly-over tour—designed expressly for nongeeks—of the acceleration and optimization landscape over the past 20 or so years.
The goal here is to show you how solutions have evolved from relatively simple (i.e., throw more servers at the problem) to increasingly complex and nuanced as we’ve learned more about the root causes of performance issues and how to address them.
Before getting started with talking about solutions, let’s first talk about two of the biggest problems faced by anyone who cares about making the Internet faster:
- Network latency (AKA the amount of time it takes for a packet of data to get from one point to another)
- The myth that modern networks are so fast, we no longer need to worry about latency
What Is Latency—And Why Should You Care About It?
Before we start talking about solutions, it’s helpful to identify some of the main problems. If you ask anyone in the performance industry to name the biggest obstacles to delivering faster user experiences, “latency” would probably be one of their top three answers.
Here’s a (very high-level) layperson-friendly definition of latency: as a web user, as soon as you visit a page, your browser sends out requests to all the servers that host the resources (images, JavaScript files, third-party content, etc.) that make up that page. Latency is the time it takes for those resources to travel through the Internet “pipe” and get to your browser.
Let’s put this in real-world terms. Say you visit a web page and that page contains 100 resources. Your browser has to make 100 individual requests to the site’s host server (or more likely, multiple servers) in order to pull those objects. Each of those requests experiences 75–140 milliseconds of latency. This may not sound like much, but it adds up fast. When you consider that a page can easily contain 300 or more resources, and that latency can reach a full second for some mobile users, you can see where latency becomes a major performance problem.
One of the big problems with latency is that it’s unpredictable and inconsistent. It can be affected by factors ranging from the weather to what your neighbors are downloading.
Tackling latency is a top priority for the performance industry. There are several ways to do this:
- Shorten the server round-trips by bringing content closer to users.
- Reduce the total number of round-trips.
- Allow more browser-to-server requests to happen concurrently.
- Improve the browser cache, so that it can (a) store files and serve them where relevant on subsequent pages in a visit, and (b) store and serve files for repeat visits.
While latency isn’t the only performance challenge, it’s a major one. Throughout the rest of this chapter, I’ll explain how various performance-boosting technologies address latency (and other issues).
Network Infrastructure (or, Why More Bandwidth Isn’t Enough)
A conversation about performance-enhancing technologies couldn’t take place without first acknowledging the huge advances made to the backbone of the Internet itself.
We’ve come a long way since 1993, when the World Wide Web was introduced. Back then, we were too busy being excited and amazed about the simple fact that the Internet existed to complain about the slowness of the network. Not that faster networks would have made much of a difference to how we experienced the Web. For most of us, dial-up Internet access was limited to 56 Kbps modems connecting via phone lines.
Not surprisingly, even the minimalist web pages of those times—when the average page was around 14 KB in size and contained just two resources—could take a while to load. (True story: I have a friend who taught herself to play the guitar while waiting for pages to load in her early months of using the Web.)
Today, you’d be forgiven for believing that, between our faster networks and superior connectivity, we’ve fully mitigated our early performance problems—and not a moment too soon. Modern web pages can easily reach 3 or 4 MB in size. When I hear people rationalize why this kind of page bloat isn’t a serious performance issue, one of the most common arguments that comes up is the belief that our ever-evolving networks mitigate the impact.
Do Network Improvements Actually Make Web Pages Load More Quickly?
While yes, it’s true that networks and connectivity have improved, there are some misconceptions about what those improvements mean in real-world usage. To illustrate, let’s consider the results of a set of performance tests of the Etsy.com home page, using WebPagetest.org, a synthetic performance measurement tool that simulates different realistic connection speeds and latencies. (If you want to jump straight to the key findings, skip ahead to the end of this section.)
The page was tested across five different desktop and mobile connection types (RTT stands for round-trip time—that is, the amount of time it takes for the host server to receive, process, and deliver on a request for a page resource such as images, CSS files, and so on; “latency” is another word for the delay in RTT):
- FIOS (20/5 Mbps, 4ms RTT)
- Cable (5/1 Mbps, 28ms RTT)
- DSL (1.5 Mbps/384 Kbps, 50ms RTT)
- Mobile 3G – Fast (1.6 Mbps/768 Kbps, 150ms RTT)
- Mobile 3G – Slow (780/330 Kbps, 200ms RTT)
Taking a glance at Figure 4-1, you can see that the light blue bars representing load times are not nearly as dramatically stacked as the darker blue bars that indicate bandwidth numbers.
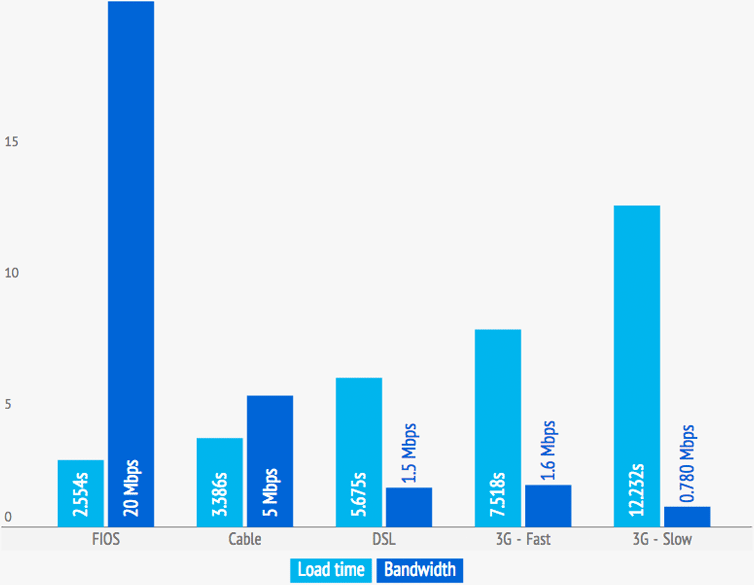
Figure 4-1. Median load times for the Etsy.com home page across a variety of different connections (via WebPagetest.com, a synthetic performance measurement tool)
Figure 4-2 is another way of looking at these numbers. If people’s supposition that bandwidth improvements correlate to proportionately faster load times was correct, then the two sides of this second graph would mirror each other. Clearly they do not.
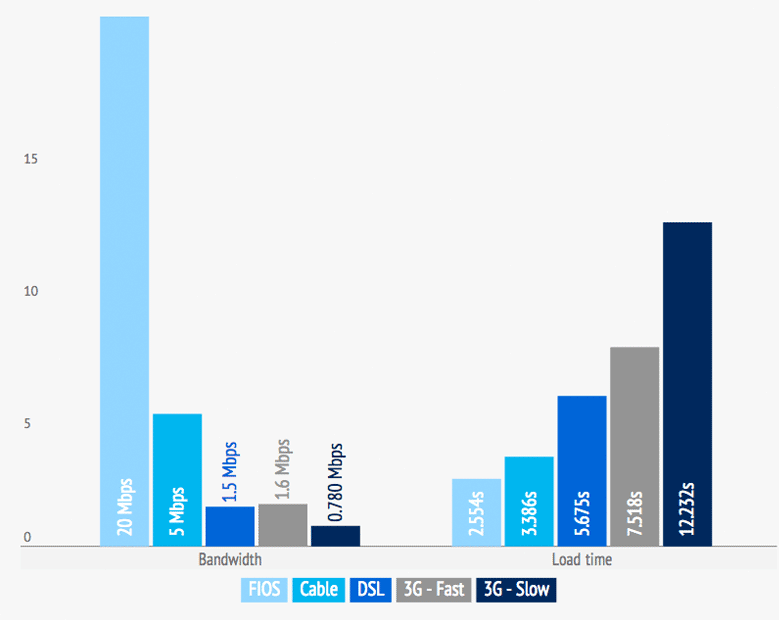
Figure 4-2. Another way of looking at Etsy.com’s performance results across connection types; if bandwidth increases correlated to proportionately faster load times, then this pair of graphs would mirror each other
A few observations:
- While download bandwidth is 300% greater for FIOS (20 Mbps) than it is for cable (5 Mbps), the median load time over FIOS (2.554 seconds) is only 24.6% faster than the median load time over cable (3.386 seconds).
- The distinction becomes even more pronounced when you compare DSL to FIOS. Bandwidth is 1,233% greater for FIOS than it is for DSL (20 Mbps versus 1.5 Mbps), yet median load time over FIOS is only 55% faster than over DSL (2.554 seconds versus 5.675 seconds).
- While DSL and “3G – Fast” have comparable bandwidth (1.5 Mbps versus 1.6 Mbps), the 3G connection is 32.5% slower (5.675 seconds versus 7.518 seconds). The key differentiator between these two connections isn’t bandwidth—it’s latency. The 3G connection has a RTT of 150ms, compared to the DSL RTT of 50ms.
- You can see the combined impact of latency and bandwidth when you compare the fast and slow 3G connections. The fast connection has 105% greater bandwidth than the slow connection, yet the median page load is only 38.5% faster (7.518 seconds versus 12.232 seconds).
How Many People Actually Have Access to Faster Networks?
Even if modern networks fully delivered the speed that we’d like to think they do, it’s important to know that a large proportion of Internet users can’t access them.
In 2015, the Federal Communications Commission updated its definition of broadband from 4 Mbps to 25 Mbps. According to this new definition, roughly one out of five Internet users—approximately 50 million people—in the United States suddenly did not have broadband access.
Some of the FCC’s other findings2 included (Figure 4-3):
- More than half of all rural Americans lack broadband access, and 20% lack access even to 4 Mbps service.
- 63% of residents on tribal lands and in US territories lack broadband access.
- 35% of US schools lack access to “fiber networks capable of delivering the advanced broadband required to support today’s digital-learning tools.”
- Overall, the broadband availability gap closed by only 3% between 2014 and 2015.
- When broadband is available, Americans living in urban and rural areas adopt it at very similar rates.

Figure 4-3. According to the FCC, a sizeable portion of people living in the United States lack anything remotely resembling high-speed Internet service
Whether you’re a site owner, developer, designer, or any other member of the Internet-using population, chances are you fall into the general category of urban broadband user. And there’s also a chance that you believe your own speedy user experience is typical of all users. This isn’t the case.
Servers
For much of the history of the Internet, performance problems have been blamed on servers. “Server overload” was commonly cited as the culprit behind everything from sluggish response times to poor page rendering. So the catch-all cure for performance pains emerged: throw more servers at the problem.
The myth that server load was the cause of most performance issues began to be put to rest in 2007, when Steve Souders’s book High Performance Web Sites (O’Reilly)—which remains the bible for frontend developers and performance engineers—was released. In 2007, Steve famously said:
80%–90% of the end user response time is spent on the frontend. Start there.
This finding has proven consistent over the years. For the majority of sites, only 10%–20% of response time happens at the backend. To illustrate, Figure 4-4 shows the proportion of backend time (in blue) compared to frontend time (in green). In this specific instance, 86% of response time happened at the frontend.
The takeaway from this: yes, you do need to ensure that your servers are up to the task of hosting your site and meeting traffic demands, but chances are you’re already covered in this area.
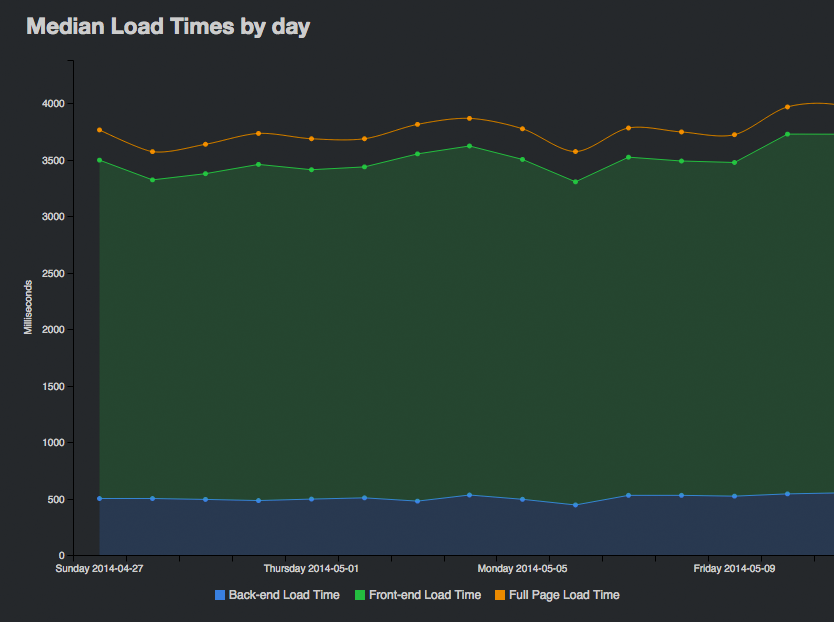
Figure 4-4. Frontend (green) versus backend (blue) load times for a leading ecommerce site
Load Balancers and ADCs
A major advance occurred in the late 1990s, when server engineers recognized that, just as routing enabled more wires to carry more messages, load balancing could enable more servers to handle more requests. Individual web servers gave way to server farms and datacenters. These server farms equipped themselves with load balancers—technology that (as its name suggests) balances traffic load across multiple servers, preventing overload caused by traffic surges.
By 2007, load balancers had evolved into sophisticated application delivery controllers (ADCs). I should mention here that the issue of whether ADCs evolved from load balancers is the subject of some hairsplitting, with many folks arguing that ADCs are much more than just advanced load balancers. But for our purposes here, it’s sufficient to know that the two technologies are frequently connected, even if they’re evolutionarily light years apart.
In addition to simple load balancing, modern ADCs optimize database queries, helping speed up the dynamic construction of pages using stored data. ADCs also monitor server health, implement advanced routing strategies, and offload server tasks such as SSL termination and TCP connection management.
Content Delivery Networks (CDNs)
As websites continued to compete for attention, page content shifted from being mostly styled text to containing a huge variety of images and other media. Support for stylesheets and client-side scripts further added to the number of objects that browsers needed to fetch in order to render each page. This multiplying of requests per page also multiplied the impact of network latency, which led to the next big innovation: content delivery networks.
While CDNs also solve performance-related problems such as improving global availability and reducing bandwidth, the main problem they address is latency: the amount of time it takes for the host server to receive, process, and deliver on a request for a page resource (images, CSS files, etc.). Latency depends largely on how far away the user is from the server, and it’s compounded by the number of resources a web page contains.
For example, if all your resources are hosted in a server farm somewhere in Iowa, and a user is coming to your page from Berlin, then each request has to make a long round-trip from Berlin to Iowa and back to Berlin. If your web page contains 100 resources (which is at the low end of normal), then your visitor’s browser has to make 100 individual requests to your server in order to retrieve those objects.
A CDN caches static resources in distributed servers (AKA edge caches, points of presence, or PoPs) throughout a region or worldwide, thereby bringing resources closer to users and reducing round-trip time (Figure 4-5).
Like any technology, CDNs have evolved over the years. First-generation CDNs, which were introduced in the late 1990s, focused simply on caching page resources. More recent iterations allow you to cache dynamic content and even develop on the edge.
While using a CDN is a must for many sites, it’s not necessary for every site. For example, if you’re hosting locally and if your users are also primarily local, a CDN won’t make you much faster (though it can still help lighten your bandwidth bill).
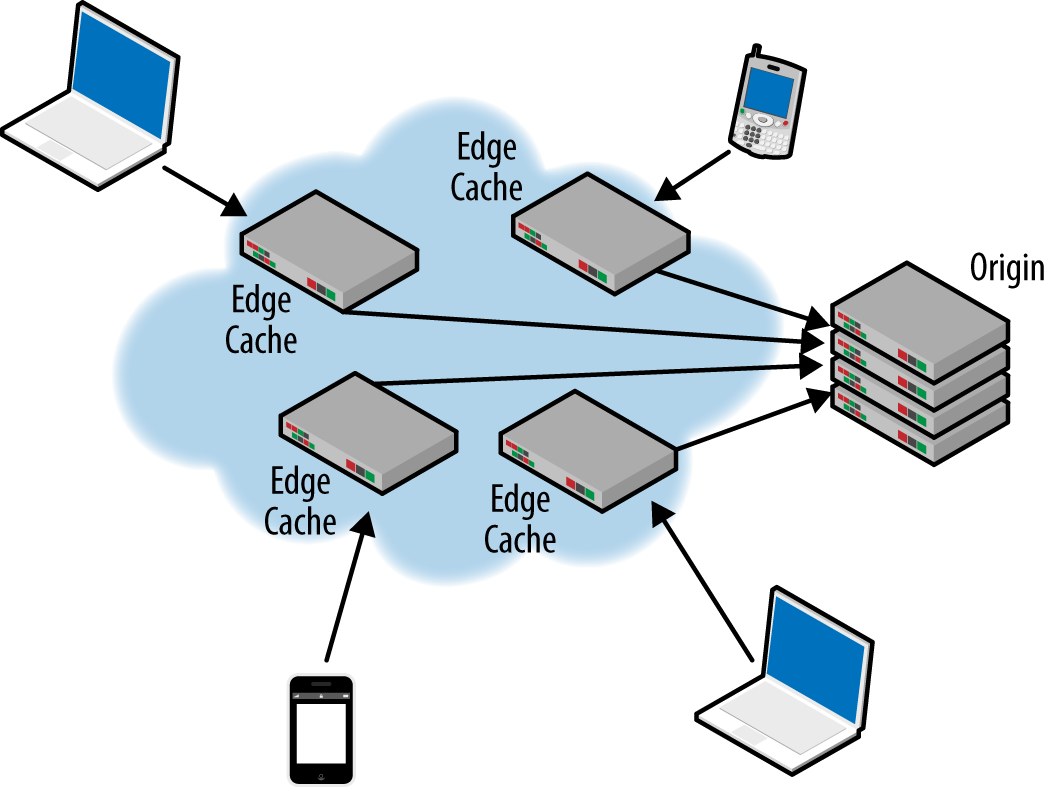
Figure 4-5. A simplified view of how a CDN deploys edge caches, bringing static page assets closer to end users
A CDN is not a standalone performance solution. There are a number of performance pains a CDN can’t cure, such as:
- Server-side processing
- Third-party scripts that block the rest of the page from rendering
- Badly optimized pages, in which nonessential content renders before primary content
- Unoptimized images (e.g., images that are uncompressed, unconsolidated, nonprogressive, and/or in the wrong format)
- Unminified code
Your CDN can’t help you with any of those problems. This is where frontend optimization comes in.
Frontend Optimization (FEO)
Building out high-speed networks, load balancing within the datacenter, reducing network latency with CDNs—these are all effective performance solutions, but they’re not enough.
CDNs address the performance middle mile by bringing resources closer to users—shortening server round-trips, and as a result, making pages load faster. Frontend optimization (FEO) tackles performance at the frontend so that pages render more efficiently in the browser.
Frontend optimization addresses performance at the browser level, and has emerged in recent years as an extremely effective way to supplement server build-out and CDN services. One way that FEO alleviates latency is by consolidating page objects into bundles. Fewer bundles means fewer trips to the server, so the total latency hit is greatly reduced. FEO also leverages the browser cache and allows it to do a better job of storing files and serving them again where relevant, so that the browser doesn’t have to make repeat calls to the server.
The four main FEO strategies for improving performance are:
-
Reduce the number of HTTP requests required to fetch the resources for each page (by consolidating resources).
-
Reduce the size of the payload needed to fulfill each request (by compressing resources).
-
Optimize client-side processing priorities and improve script execution efficiency (by ensuring that critical page resources load first, and deferring noncritical resources).
-
Target the specific capabilities of the client browser making each request (such as by leveraging the unique caching capabilities of each browser).
All of these strategies require changes to the HTML of the web page and changes to the objects being fetched by the page.
Steve Souders brought attention to frontend optimization with his book High Performance Web Sites. At the time, the only way to optimize your pages was by hand, via highly talented developers. Over the years, FEO has evolved into a highly sophisticated set of practices, some of which can only be performed by hardware- or software-based solutions.
While frontend optimization can be performed manually by developers, many site owners have turned to products and services that automate the process of page optimization. These tools implement FEO best practices by automatically modifying HTML in real time as pages are being served. Some CDNs now offer FEO as a value-added service.
Mobile Optimization
Today, roughly one out of four people worldwide own a smartphone. By 2020, that number is expected to increase to four out of five (see Figure 4-6). That’s more than six billion mobile devices all connected to this massive infrastructure. Stop and think about that for a minute.

Figure 4-6. Ericsson, 2015 Mobility Report
With the proliferation of mobile devices has come a host of unique issues that deeply affect mobile performance, from low-horsepower devices to network slowdowns.
One of the biggest performance issues (and one that is not unique to mobile) is page bloat. Pages served to mobile continue to balloon beyond our networks’ ability to serve them (see Figure 4-7).
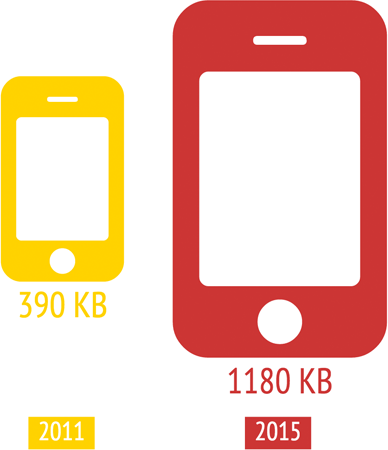
Figure 4-7. According to the HTTP Archive, the average page served to a mobile device is well over 1 MB in size—three times larger than it was in 2011
Despite these constraints, user expectations continue to grow: a typical mobile user expects a site to load as fast—or faster!—on their tablet or smartphone as it does on desktop.
Developing mobile-specific optimization techniques is the newest FEO frontier. These are just a few of the issues and opportunities mobile FEO seeks to address:
- Mobile networks are usually slower than those available to desktop machines, so reducing requests and payloads takes on added importance.
- Mobile browsers are slower to parse HTML and slower to execute JavaScript, so optimizing client-side processing is crucial.
- Mobile browser caches are much smaller than those of desktop browsers, requiring new approaches to leveraging local storage of resources that are reused on multiple pages of a user session.
- Small-screen mobile devices present opportunities for speeding transmission and rendering by resizing images so as not to waste bandwidth, processing time, and cache space.
Our use of mobile devices is exploding. Our expectations for performance are unrelenting. And modern websites place ever-increasing levels of strain on mobile networks, devices, and browsers. Mobile is arguably the greatest battlefield for performance today.
Performance Measurement
Getting an accurate measurement for how long it took a web page to load used to be difficult and somewhat imperfect. In the olden days (you know, 2005), if you built a website, you had zero ability to look outside your own datacenters to get an understanding of performance. As websites evolved, the digital experiences we were able to serve over the Web became more and more complex. Images, video, and other rich content added more and more delay, which ultimately hurt the user’s experience.
Unfortunately, in the past, none of this could be captured with simple backend measurements. This lack of visibility into the user experience drove website owners to look at different ways of measuring performance. This yielded advanced measurement capabilities like synthetic measurement and, later, real user monitoring. Finally, with these tools, site owners could see beyond the walls of their organization to get a real sense of how their applications were performing in the wild.
Website monitoring solutions fall into two types: synthetic and real user monitoring (RUM). Each of these types offers invaluable insight into how your site performs, but neither one is a standalone. Rather, they’re highly complementary and can be used to gain a 360-degree view of performance.
Synthetic performance measurement
Synthetic performance measurement (which you may sometimes hear called “active monitoring”) is a simulated health check of your site. You create scripts that simulate an action or path that an end user would take on your site, and those paths are monitored at set intervals.
What synthetic performance testing can tell you
Synthetic performance tests offer a unique set of capabilities that complement RUM extremely well. In addition to offering page-level diagnostics, synthetic tools allow you to measure a number of metrics—such as response time, load time, number of page assets, and page size—from a variety of different connection types. You can also test your site in production to find problems before the site goes live.
These are just a few of the questions that synthetic measurement can answer for you:
- How do you compare to your competitors?
- Unlike real user monitoring, synthetic tools let you test any site on the Web, not just your own (Figure 4-8).
- How does the design of your pages affect performance?
- Synthetic measurement gives you an object-level detail of page assets, letting you closely inspect the design and physical make-up of a page in a controlled environment.
- How does the newest version of your site compare to previous versions?
- Benchmark performance before and after new deployments in order to pinpoint what made pages faster or slower.
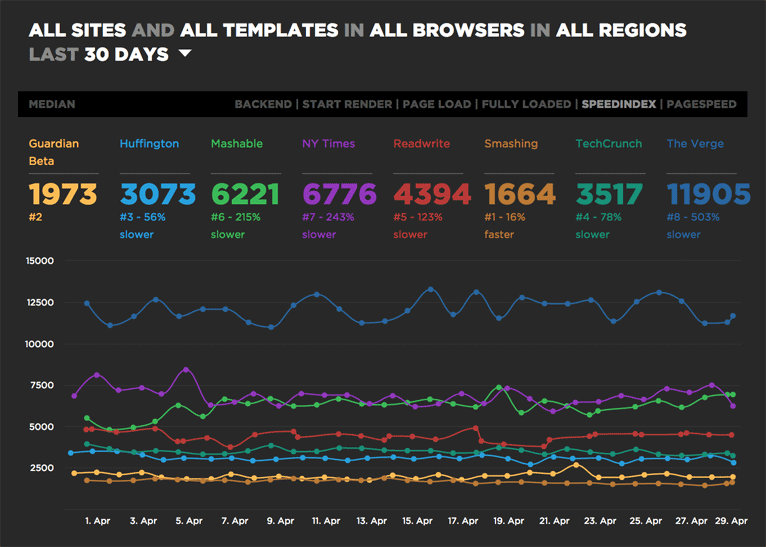
Figure 4-8. This synthetic benchmark test shows the side-by-side performance of a handful of popular media sites (via SpeedCurve)
What synthetic measurement can’t tell you
Synthetic measurement can tell you a great deal about how a page is constructed, but there are gaps in what it can tell you:
- Synthetic measurement gives you a series of performance snapshots, not a complete performance picture. Synthetic tests are periodic, not ongoing, so you can miss changes and events that happen between tests.
- Because you have to script all your tests, you’re limited by the number of paths you can measure. Most site owners only look at a handful of common user paths.
- Synthetic tests can’t identify isolated or situational performance issues (i.e., they cannot pinpoint how your performance is affected by traffic spikes or short-term third-party outages and slowdowns).
Real user monitoring (RUM)
Real user monitoring is a form of passive monitoring that “listens” to all your traffic as users move through your site. Because RUM never sleeps, it gathers data from every user using every browser across every network, anywhere in the world. We’re talking about petabytes of data collected over billions of page views,
The word “passive" is a misnomer, because modern RUM is anything but passive. Today, the best RUM tools have powerful analytics engines that allow you to slice and dice your data in endless ways.
RUM technology collects your website’s performance metrics directly from the browser of your end user. You embed a JavaScript beacon in your web pages. This beacon gathers data from each person who visits that page and sends this data back to you to analyze in any number of ways.
What real user monitoring can tell you
In addition to the usual page metrics, such as load time, real user monitoring can teach you a great deal about how people use your site, uncovering insights that would otherwise be impossible to obtain.
Here are just a few questions your RUM data can answer:
- How is your site affected by traffic surges? Does performance degrade over time?
- What are your users’ environments? What kind of browser, device, and operating system are they using to visit your site?
- How do users move through your site? Visitors rarely travel in a straightforward line. Real user monitoring lets you measure performance for every permutation of a navigational path an end user might take through your website (Figure 4-9).
- How are your third-party scripts performing in realtime?
- What impact does website performance have on your actual business? RUM lets you connect the dots between website performance and UX/business metrics such as bounce rate, page views, time on site, conversion rate, and revenue. It can also show you which pages on your site are most affected by performance slowdowns, giving you guidance as to where to focus your optimization efforts.

Figure 4-9. This sunburst chart, created using RUM data, depicts common user paths through a website (via SOASTA mPulse)
What real user monitoring can’t tell you
Just as synthetic measurement has its strengths and weaknesses, so does RUM:
- Because of the way RUM is implemented (with JavaScript beacons embedded in your pages), it can’t measure your competitors’ sites and benchmark your performance against theirs.
- RUM is deployed on live sites, so it can’t measure performance on your pages when they’re in pre-production.
- While RUM does offer some page diagnostics, many tools today don’t take a deep dive into analyzing performance issues.
Will Browser Evolution Save Us?
I’d be remiss if I left this chapter without touching on browser performance. Throughout the entire history of the World Wide Web, developers have been chugging away in the background, building the most essential app of all—the browser—without which none of us would be able to access the Internet as we know it.
Being a browser developer is thankless work. When we have slow online experiences, we tend to curse the sites we visit, the networks we use, and our poor, hard-working browsers. Yet it’s arguable that browser evolution has done more than any other technology to mitigate the performance impact caused by badly designed, poorly optimized sites. (Let’s not forget that our comrades at Google were pioneering performance best practices when this issue was just a glimmer on the horizon for most of us.)
From at least the mid-2000s, browser vendors have factored performance into every new release, with the focus on performance becoming stronger with every year.
More recently, web browsers have been getting some pretty major performance upgrades, such as:
- W3C Beacon API
- Deploying beacons on a page can be problematic. The amount of data that can be transferred is severely limited, or the act of sending it can have negative impact on performance. With the new Beacon API, which is supported by most browsers, data can be posted to the server during the browser’s unload event in a performant manner, without blocking the browser.
- HTTP/2
- Leading browsers support HTTP/2, which offers a number of performance enhancements, such as multiplexing and concurrency (several requests can be sent in rapid succession on the same TCP connection, and responses can be received out of order); stream dependencies (the client can indicate to the server which resources are most important); and server push (the server can send resources the client has not yet requested).
- Service Workers
- A Service Worker is a script that is run by your browser in the background, separate from a web page, opening the door to features that don’t need a web page or user interaction. There are countless great ways to deploy Service Workers to provide performance enhancements—for example, pre-fetching resources that the user is likely to need in the near future, such as product images from the next pages in a transaction path on an ecommerce site.
The W3C’s Web Performance Working Group has also created a substantial handful of real user monitoring specifications (e.g., navigation timing, resource timing, user timing) for in-browser performance diagnostics. This gives site owners the unprecedented ability to gather much more refined and nuanced performance measurements based on actual user behavior.
Individually, each of these enhancements solves a meaningful performance problem. Collectively, these browser enhancements have the potential to fundamentally move the needle on performance in a way that hasn’t been seen in years.
Takeaway
Most people have a basic understanding of Moore’s law: the observation that computer processing power doubles roughly every two years. Fewer people are familiar with Wirth’s law, which states that software is getting slower more rapidly than hardware is getting faster.
Wirth’s law was coined back in 1995, but it’s a fairly accurate summary of the web performance conundrum. Regardless of how much money we invest in building out the infrastructure of the Internet, latency will continue—well into the foreseeable future—to be one of the greatest obstacles to optimal web performance. This is due to a couple of issues:
- Rampant increases in page size and complexity.
- For every potentially performance-leeching content type that we see fall out of use (e.g., Flash), a new one rises to take its place (e.g., third-party scripts). And the new one has the potential to be an even worse performance problem than the one it displaces.
Web pages are not likely to become smaller and less complex, so it’s fortunate that a huge—and rapidly growing—industry has grown out of the need for making pages more performant.
Get Time Is Money now with the O’Reilly learning platform.
O’Reilly members experience books, live events, courses curated by job role, and more from O’Reilly and nearly 200 top publishers.

