RECTANGLE PATTERNS
Theory is one thing, but getting down to doing it right is quite another. A rectangle is one pattern that is difficult to trade, particularly when the trading range is narrow.
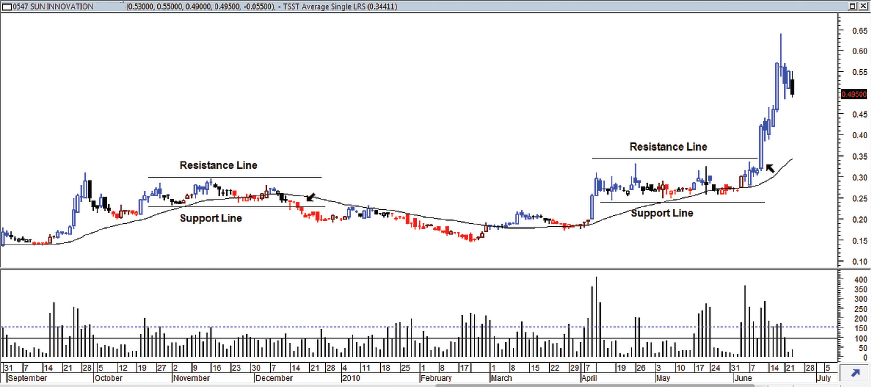
A rectangle pattern is a consolidation phase in which the bulls and the bears are in a tug of war, with neither side in decisive control. (See Figure 3.22.) It is normally expected for prices to continue in the same direction the market was trading in before the consolidation began. An important point to take note of is that the pattern is not complete until a breakout has successfully occurred.
FIGURE 3.22 Two examples of rectangles. The first rectangle shows the force of the bears pushing prices below the support level. The second rectangle shows the bulls, after a long consolidation, taking control and pushing prices to a new high.
Rectangle patterns are sometimes called box patterns. You do not often hear market commentators mention them in the news. They usually refer to the pattern as a trading range or a consolidation. (See Figure 3.23.) Rectangle patterns represent a period of range trading during which prices move between two parallel trend lines: the upper resistance line, which connects the highs; and the lower support line, which connects the lows. Prices will test the levels of support and resistance several times before a breakout from the upper and lower boundaries. Once ...
Get Timing Solutions for Swing Traders: A Novel Approach to Successful Trading Using Technical Analysis and Financial Astrology now with the O’Reilly learning platform.
O’Reilly members experience books, live events, courses curated by job role, and more from O’Reilly and nearly 200 top publishers.

