AB=CD PATTERNS
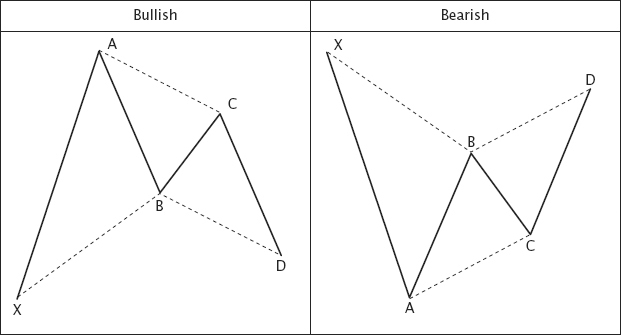
The AB=CD pattern is a classic pattern found in all time frames. The pattern was highlighted as the Gartley Pattern in H. M. Gartley’s 1935 book, Profits in the Stock Market. The key to the pattern is the distinct parallelogram of ABCD, where AB=CD and AC is parallel to BD. (See Figure 3.29.) Gartley did not specify any application of Fibonacci ratios, but in later years, technicians added the applicable ratios to it. The important ratios were that B should be at 0.618 of XA and D should be at 0.786 of XA.
FIGURE 3.29 Gartley bullish and bearish patterns.
The concept of AB=CD is also mentioned in Elliott Wave Theory. In the formation of five impulse waves (see Chapter 4, Elliott Waves), when Wave 1 is extended, Wave 3 may be equal to Wave 5. And when Wave 5 is extended, Wave 1 and Wave 3 may be equal. Each point, X, A, B, C, and D, is a significant high or low. The points A, B, C, and D represent three consecutive price swings. AB may represent Wave 1 or Wave 3 in an impulse waves pattern, or Wave A in a corrective wave pattern; BC represents Wave 2, Wave 4, or Wave B; and CD represents Wave 3, Wave 5, or Wave C. (See Figure 3.30.)
FIGURE 3.30 Formations of AB=CD patterns. In a valid AB=CD pattern, D is the area for considering trade entries in a bullish AB=CD, and for making trade exits in a bearish AB=CD.
AB=CD is a very common pattern found in the measurement ...
Get Timing Solutions for Swing Traders: A Novel Approach to Successful Trading Using Technical Analysis and Financial Astrology now with the O’Reilly learning platform.
O’Reilly members experience books, live events, courses curated by job role, and more from O’Reilly and nearly 200 top publishers.

