PROTECTIVE STOPS
Figure 6.18 shows a strong trending stock plotted with protective stops. Volume is plotted in the lower window.
FIGURE 6.18 Plot of protective stops indicated by black dotted line.
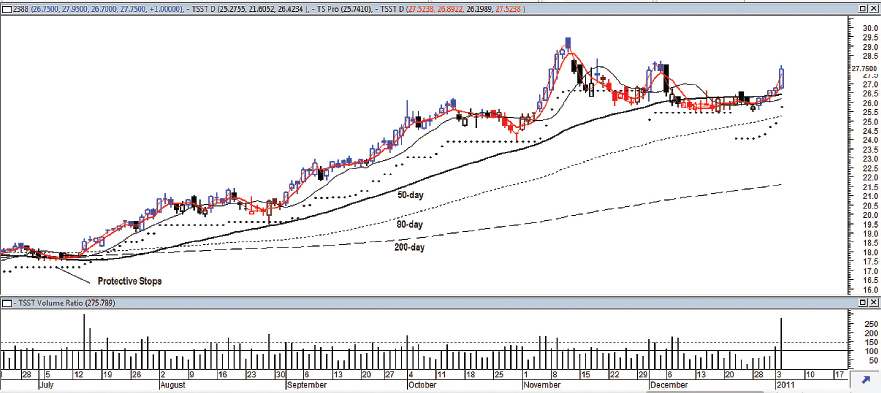
Average true range is commonly used in the calculation of protective stops (or stop losses). Average true range is a volatility indicator that measures the strength of price reactions. That is, the price movements from low volatility to high volatility and from high volatility to low volatility. The formula for average true range is included in all technical analysis program packages. Protective stops may also be used as a guide for trade entries and exits. In a long position, a trade exit is triggered when prices close below protective stops. And when prices close above or remain above protective stops, a trade entry may be considered if other indicators are also showing support of the probable positive trend.
There are many stop-loss or trailing stops systems available, but getting the right parameters and settings of such stops can be difficult. When the market is choppy, trailing stops will always be triggered too soon if the stops are set too close to the price bars. And on the other hand, if the stops are set too far apart, traders will probably not be able to lock in their profits as their stops will never be reached.
The following is a simple formula of the protective stops ...
Get Timing Solutions for Swing Traders: A Novel Approach to Successful Trading Using Technical Analysis and Financial Astrology now with the O’Reilly learning platform.
O’Reilly members experience books, live events, courses curated by job role, and more from O’Reilly and nearly 200 top publishers.

