SUPPORTING MOVING AVERAGES
Continuing with the example of the weekly chart, we shall enhance it with further supporting indicators, including two additional sets of moving averages and a volume indicator, as shown in Figure 7.2.
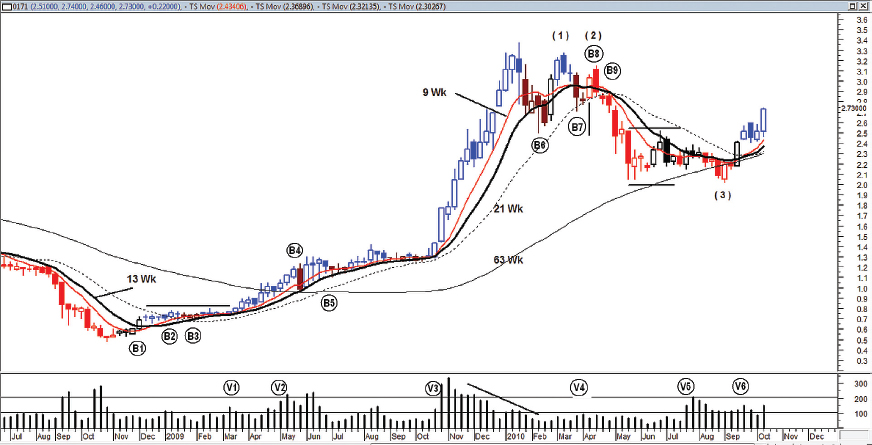
FIGURE 7.2 Reading of the weekly chart is improved with the additional supporting indicators of a set of mid-term moving averages, a set of longer-term moving averages, and a volume indicator. Through trial and error, it was found that a 63-week moving average line correlates closely with the support and resistance levels of this stock.
Before going into reading Figure 7.2, traders need to know how the weekly chart is constructed in the system. Each bar of the weekly chart represents the price range of the trading days of that week. If the week has three trading days, the bar represents the range of the three days. The opening price of the weekly bar is the opening price of the first trading day in the week, the closing price is the closing price of the last trading day of the week, the high represents the highest price of the week, and the low represents the lowest price of the week.
Thus, each weekly bar is a summary of the trading days of the week, from Monday to Friday, and trying to find which day in the coming week will be the best day to buy or sell would be difficult. Weekly bars may often be very volatile, and for those who do their trading based ...
Get Timing Solutions for Swing Traders: A Novel Approach to Successful Trading Using Technical Analysis and Financial Astrology now with the O’Reilly learning platform.
O’Reilly members experience books, live events, courses curated by job role, and more from O’Reilly and nearly 200 top publishers.

