MINOR HIGH SUPPORT
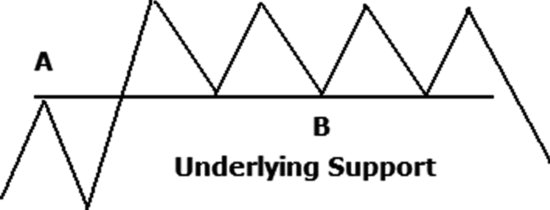
It may sound odd that peaks show support. When you think of a peak or minor high, the reason it is a peak is that price could not move higher because of overhead resistance. How then can a peak show support? Figure 4.4 provides the answer. Price drops down from above (at B) and finds support at the price level of the first peak (A).
Figure 4.4 Test configuration: Peaks showing support.
Peaks lending support is the scenario I tested next. For this test, I used data from stocks starting in June 1996 and ending in June 2010. The test excluded any stock below $5 and those without data extending back to mid-1996.
I found every peak in a seven-year window and followed each one for seven years, counting the number of times a valley stopped near the same peak compared to the number of times price punched through without showing support. Table 4.2 shows the results.
Table 4.2 Percentage of Peaks Showing Support

For example, 39 percent of the time stocks showed support at the price of a peak sometime during a year after the peak formed. Support moved up to 45 and 46 percent in years 2 through 5 before easing back to 42 percent. This test shows that support does not diminish over time. Rather, it gets stronger (until after year 5, that is). This is the same result I found ...
Get Trading Basics: Evolution of a Trader now with the O’Reilly learning platform.
O’Reilly members experience books, live events, courses curated by job role, and more from O’Reilly and nearly 200 top publishers.

