July 2024
Beginner
5 pages
4m
English
Using Tableau Desktop’s drag-and-drop interface makes forming your charts straightforward, but there are a few challenging aspects you are likely to come across from time to time. One instance where Tableau might behave differently from how you expect is when you try to place two metrics on to the same axis or space on a view. You will try to do this when you want to compare two measures directly.
This shortcut shows you how dragging your data fields to a slightly different position can allow you to form the charts you want to. Tableau uses two autogenerated elements, Measure Names and Measure Values, to allow you to show two or more measures in the same space.
To enter two measures onto the same axis of a chart, you just need to drag and drop the second measure you want to show onto the same axis where the first measure is already present. In our example, the Profit measure has been dragged onto the vertical axis formed by Sales.
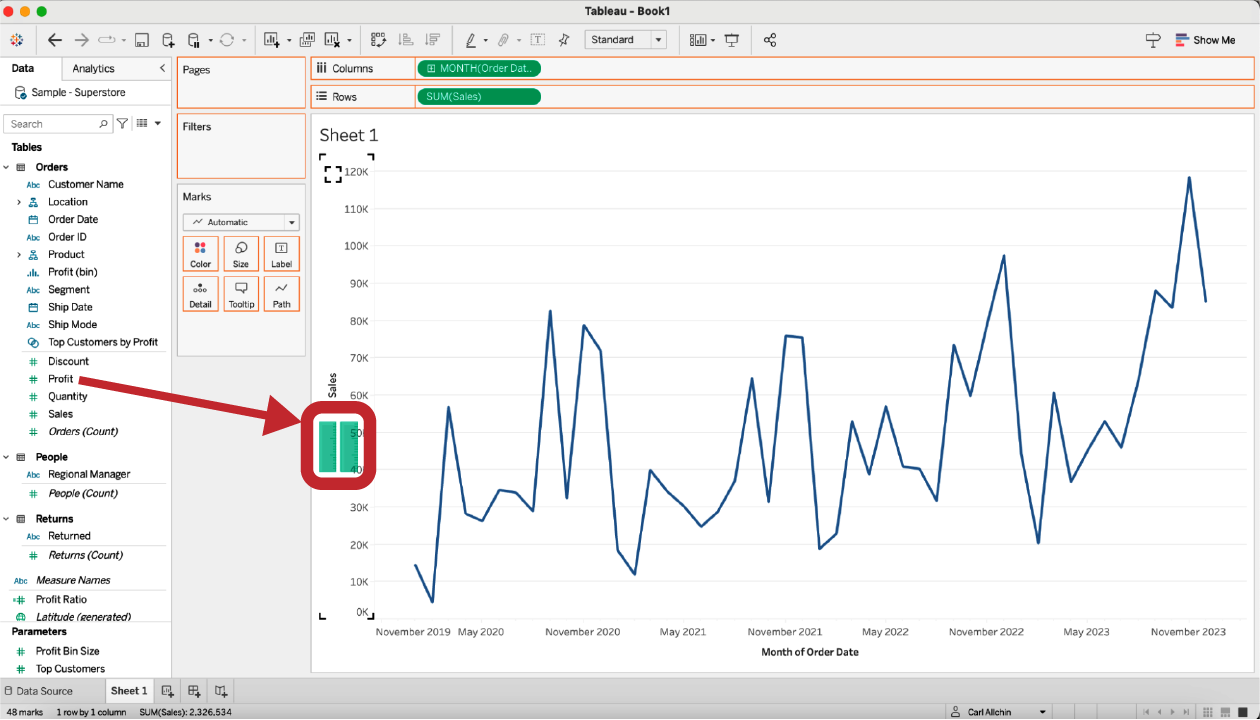
The two green vertical bars in the figure demonstrate Tableau recognizing that you are trying to put two measures together on the same axis. When you release your mouse button to drop the Profit measure onto the axis, Tableau Desktop will make a few changes to the arrangement of the data ...
Read now
Unlock full access


 O’Reilly covers everything we've got, with content to help us build a world-class technology community, upgrade the capabilities and competencies of our teams, and improve overall team performance as well as their engagement.I wanted to learn C and C++, but it didn't click for me until I picked up an O'Reilly book. When I went on the O’Reilly platform, I was astonished to find all the books there, plus live events and sandboxes so you could play around with the technology.I’ve been on the O’Reilly platform for more than eight years. I use a couple of learning platforms, but I'm on O'Reilly more than anybody else. When you're there, you start learning. I'm never disappointed.I'm always learning. So when I got on to O'Reilly, I was like a kid in a candy store. There are playlists. There are answers. There's on-demand training. It's worth its weight in gold, in terms of what it allows me to do.