12.4 PROJECT 12.4 – GLCD X-Y Plotting
12.4.1 Project Description
This project will demonstrate how the graph of a function can be plotted on the GLCD. In this project, the graph of y = x2 − 1 is plotted as an example, with x varying between −2 and +2.
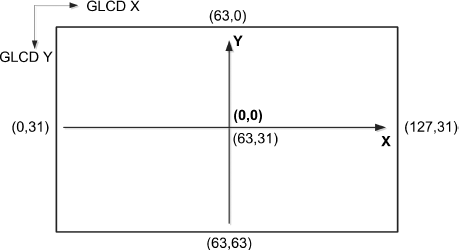
The mid-point of the GLCD screen is taken as the co-ordinate centre point of the X-Y axis, and the two axes are drawn from this point, as shown in Figure 12.24, that is the GLCD co-ordinate (63,31) is taken to be the (0,0) co-ordinate point of our axes. The X-axis is the horizontal axis extending from left to right. Similarly, the Y-axis is the vertical axis extending from bottom to top.
Figure 12.24 The GLCD screen co-ordinates and X-Y co-ordinates

12.4.2 Block Diagram
The block diagram of the project is as shown in Figure 12.5.
12.4.3 Circuit Diagram
The circuit diagram of the project is as shown in Figure 12.6.
12.4.4 Project PDL
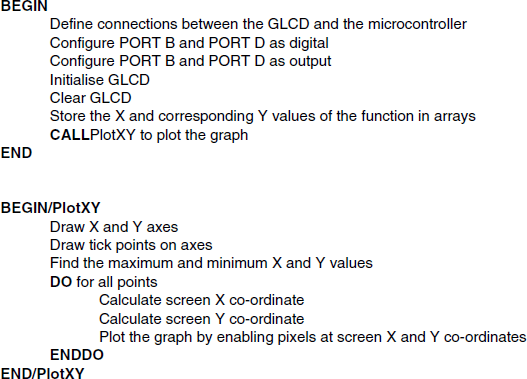
The PDL of this project is given in Figure 12.25.
Figure 12.25 PDL of the project

12.4.5 Project Program
Figure 12.26 shows the program listing (GLCD5.C) of the project. At the beginning of the program, the connection between the microcontroller and the GLCD are defined using sbit statements. The GLCD is connected to ports B and D of the microcontroller and thus both of these ports are configured as digital ...
Get Using LEDs, LCDs and GLCDs in Microcontroller Projects now with the O’Reilly learning platform.
O’Reilly members experience books, live events, courses curated by job role, and more from O’Reilly and nearly 200 top publishers.

