Skip to Content
Visualization Analysis and Design
book

Visualization Analysis and Design

by Tamara Munzner
December 2014
Intermediate to advanced
428 pages
11h 8m
English
A K Peters/CRC Press
Content preview from Visualization Analysis and Design

Chapter 13

Reduce Items and Attributes

13.1 The Big Picture

Figure 13.1 shows the set of design choices for reducing—or increasing—what is shown at once within a view. Filtering simply eliminates elements, whereas aggregation combines many together. Either choice can be applied to both items or attributes.

Figure 13.1.

Figure Showing design choices for reducing (or increasing) the amount of data items and attributes to show.

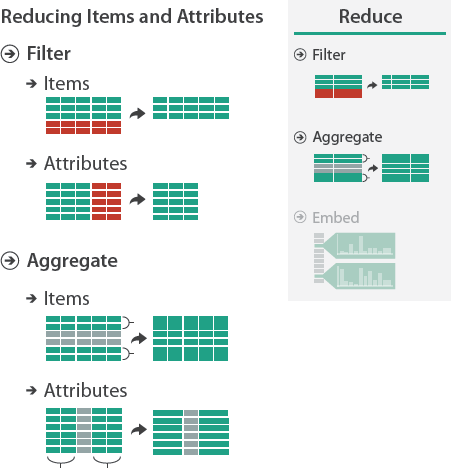
Design choices for reducing (or increasing) the amount of data items and attributes to show.

13.2 Why Reduce?

Reduction is one of five major strategies for managing complexity in visualizations; as pointed out before, these five choices are not mutually exclusive, and various combinations of them are common.

Typically, static ...

Become an O’Reilly member and get unlimited access to this title plus top books and audiobooks from O’Reilly and nearly 200 top publishers, thousands of courses curated by job role, 150+ live events each month,
and much more.
Start your free trial

You might also like

Storytelling with Data: A Data Visualization Guide for Business Professionals

Storytelling with Data: A Data Visualization Guide for Business Professionals

Cole Nussbaumer Knaflic
Storytelling with Data

Storytelling with Data

Cole Nussbaumer Knaflic

Publisher Resources

ISBN: 9781466508910