June 2001
Intermediate to advanced
320 pages
9h 18m
English
Figure A-4 shows the Zipf-like distribution of object popularity. The X-axis is the popularity rank. The most popular object has a rank of 1, the second most popular object a rank of 2, and so on. The Y-axis is the number of requests for each object. Note that both axes have a logarithmic scale.
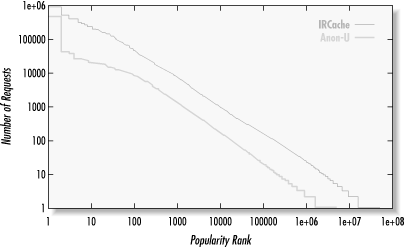
Figure A-4. Popularity distributions (IRCache and Anon-U data)
We say the distribution is Zipf-like because it almost follows Zipf’s law. This law, named after George Kingsley Zipf, describes things such as the frequency of words in English texts and the populations of cities. It is also useful for characterizing the popularity of web objects. Specifically, the probability of access for the ith most popular object is proportional to i-a . In Zipf’s law, the exponent a is close to 1. For web traffic, the exponent is typically between 0.6 and 0.8.
This data is derived by counting the number of times each URL occurs in Squid’s access.log. After getting these counts, the particular URLs are unimportant. The values are sorted and plotted against their rank in the list.
For comparison, I show curves for both the IRCache and Anon-U data sets. The Anon-U plot is below the IRCache plot because it has significantly fewer accesses. The two appear to be similar, except that the Anon-U line slopes down much more for the 100 most popular objects.
Back in Section 2.4, and Section ...
Read now
Unlock full access


