Chapter 25. GD-Graph3d
When it comes to understanding large amounts of data, we humans have two stages of interpretation. First, we analyze the data, organizing it in myriad ways to find the hidden relationships, quantities, and trends that deliver meaning to our world. Second, we present it somehow, often by displaying it visually. With graphs and charts we can visualize trends, understand relationships, and compare quantities at a glance.
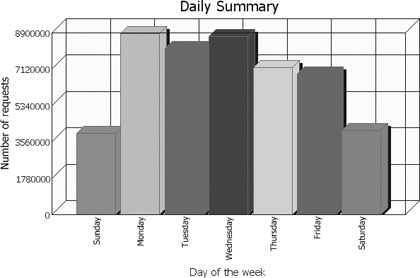
I developed the Perl package GD-Graph3d to accompany some statistics presentation tools I work on for analyzing the huge amounts of data available to and generated by web servers. Our freely available Report Magic presentation package uses GD-Graph3d to present analyses in a friendly manner with graphs like Figure 25-1.
GD-Graph3d is an extension to Martien Verbruggen’s GDGraph
package. GDGraph draws only two-dimensional images (except for the
3d option on pie charts) but provides the basis for
data management, labeling, legends, and other routine graph operations
that are common to both packages.
Using GD-Graph3d
In order to use GD-Graph3d, you will need to install several
packages: at a minimum, the GDGraph, GD-TextUtil, and GD Perl modules,
and the libgd library. Fortunately for Windows and
Mac users, GD and the libgd library are included in ActivePerl and MacPerl. If you have ActivePerl, you can ...
Get Web, Graphics & Perl/Tk Programming now with the O’Reilly learning platform.
O’Reilly members experience books, live events, courses curated by job role, and more from O’Reilly and nearly 200 top publishers.

