Chapter 6. Performance Analysis
The most important thing to know about your system is if you can’t understand it easily, you can’t fix it easily. Complex systems are dependent on the few people who do understand it. If they leave, you have a big problem. A similar issue is that the number of problems rises much faster than the number of interdependent “features.” More features equal many more problems. Fortunately, all web sites have to obey standards to some degree or they would not be usable with a wide variety of browsers. Because of this standardization, there are a number of standard steps you can take to pin down your problem.
Using analysis.cgi to Find a Bottleneck
A simple first step in diagnosing a performance problem is to break down performance into five categories: DNS lookup time, connection setup time, server silence, transmission time, and connection close time. These steps always happen in this order. I’ve written a tool to automatically time each of these five steps and to generate a graph of the results and some advice. I call it analysis.cgi and it can be run from my home page, http://patrick.net/. Simply enter a URL and it will try to graph the breakdown of these components for that URL. Figure 6-1 shows an example output graph for my own home page. Here is the advice:
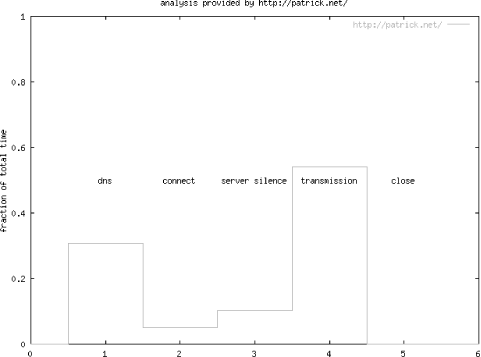
Figure 6-1. analysis.cgi graph for patrick.net
advice for http://patrick.net/ DNS I spent a ...
Get Web Performance Tuning, 2nd Edition now with the O’Reilly learning platform.
O’Reilly members experience books, live events, courses curated by job role, and more from O’Reilly and nearly 200 top publishers.

