In this section we compare and contrast the three code profilers that we used to examine the application’s consumption of processor cycles. All the tests were made on a Windows NT 4.0 Server installation, but the results apply to the Windows 2000 environment with almost no modification. Overall, we found both compiler add-on packages to be extremely useful and well worth the modest investment. Visual Quantify provides a highly intuitive user interface. It extends the CPU profiling information available through the built-in facilities of MS Visual C++ by incorporating information on many system services, and it greatly increased our understanding of the code’s interaction with various Windows 2000 system services. VTune supplemented this understanding with even more detailed information about our code’s interaction with the Windows 2000 runtime environment. VTune’s unique analysis of Intel hardware performance provides singular insight into this critical area of application performance.
The first stage of the analysis used the code execution profiler built into MS Visual C++. This is a natural place for any tuning project to begin given that no additional software packages need to be licensed and installed. Runtime profiling is enabled from the Link tab of the Project, Settings dialog box inside Developer Studio, which also turns off incremental linking. Profiling can be performed at either the function or line level. Function-level profiling counts the number of calls to the function and adds code that keeps track of the time spent in execution while in the function. Line profiling is much higher impact and requires that debug code be generated. In this exercise, we report only the results of function profiling.
Select Profile from the Tools menu to initiate a profiling run. Additional profiling options are available at runtime. The most important of these allow the user to collect statistics on only specific modules within a program or to restrict line profiling to certain lines of code. At the conclusion of the run, a text report is available in the Output window under the Profile tab. You can view the report there or import the text into a spreadsheet where the data can be sorted and manipulated. The first few lines of the function-level profile report are shown here. The output is automatically sorted in the most useful sequence, showing the functions in order by the amount of time spent in the function.
Module Statistics for dmperfss.exe
----------------------------------
    Time in module: 283541.261 millisecond
    Percent of time in module: 100.0%
    Functions in module: 155
    Hits in module: 11616795
    Module function coverage: 72.3%

        Func          Func+Child           Hit
        Time   %         Time      %      Count  Function
---------------------------------------------------------
  248146.507  87.5   248146.507  87.5      249 _WaitOnEvent (dmwrdata.obj)
    8795.822   3.1     8795.822   3.1   393329 _WriteDataToFile (dmwrdata.obj)
    4413.518   1.6     4413.518   1.6     2750 _GetPerfDataFromRegistry (dmwrdata.obj)
    3281.442   1.2     8153.656   2.9   170615 _FormatWriteThisObjectCounter (dmwrdata.obj)
    3268.991   1.2    12737.758   4.5    96912 _FindPreviousObjectInstanceCounter (dmwrdata.obj)
    2951.455   1.0     2951.455   1.0  3330628 _NextCounterDef (dmwrdata.obj)
The data is from a profiling run of the dmperfss
program that lasted about six minutes. The program was set to collect
a default collection set once a second and write this information to
a file. The following performance objects are included in this
collection set: System, Processor, Memory, Cache, Logical Disk,
Physical Disk, Process, Redirector, Server, and Network Segment.
The profiling report itself is largely self-explanatory. The amount of time spent in the function, the amount of time spent in the function and its descendants, and a Hit Count are tabulated. The specific function is identified by name, with the name of the object module that exports it in parentheses.
Interpreting the report is equally straightforward. The profiling
statistics indicate that the program spent 87.5% of its execution
time in a function called WaitOnEvent. In this function, the program
is waiting for the Windows 2000 Timer event that signals that it is
time to collect the next data sample. Notice that the Hit Count for
this function, which represents the number of times this function was
entered, is just slightly less than the number of seconds in the
execution interval. This no doubt reflects some delay in
initialization. It seems safe to assume that the program is actually
executing the other 12.5% of the time. The
WriteDataToFile function, which was entered
393,329 times, accounts for close to 25% of the program’s
actual execution time. It appears that this function is called over
1,000 times for each collection interval.
The only noticeable difficulty in working with the Visual C++ profile
report is that it does not identify the function call parent-child
relationships. Notice that the function call
FindPreviousObjectInstanceCounter is executing 1.2% of the time
(about 10% of the program’s actual active time). When functions
called by FindPreviousObjectInstanceCounter are factored in, the
function call is executing 4.5% of the time. Unfortunately, it is not
possible to identify the child functions called from a parent
function by glancing at the report. Since the programmer creating the
execution profile has access to the source code, it should be
reasonably simple to trace the function’s execution using the
debugger, for example, to determine what calls the
FindPreviousObjectInstanceCounter function makes to other helper
functions. But in practice, for a program as complex as
dmperfss, this is not a trivial exercise.
While the built-in execution profiler is not as robust as other available tools, it did help us identify the program modules that had the greatest impact on performance. The C++ profile report was consistent with later analysis results that honed in on the same relatively small set of modules that were responsible for a disproportionate amount of CPU time consumption. While not as comprehensive as the other tools, the Microsoft Visual C++ profile option proved both easy to use and effective.
Rational
Visual Quantify is an add-on code
profiling tool for Windows 2000 that works with Microsoft Visual C++,
Visual Basic, and Java running on Intel hardware. It addresses the
major usability limitations we encountered with the profiler built
into the Microsoft C++ compiler. First and foremost, it has an
intuitive GUI interface that makes it easy to navigate through the
profiling output. But Visual Quantify (or VQ, for short), we found,
is more than just a pretty face. The profiling data it collects
extends to an impressive number of system modules and services. VQ
measures the performance impact associated with third-party ActiveX
and DLL-based components that your program links to dynamically. It
also captures the amount of processor time spent inside a surprising
number of Win32 API calls. Acquiring profiling information on the
overhead of the dmperfss program during function
calls to external modules outside the executable
was of great benefit in this context.
Like the Visual C++ profiler, VQ gathers information at the level of either the function or the line, and also provides options that allow you to specify when you want the profiling data collection effort to begin. This lets you bypass initialization code and focus on the application’s inner loop, for example. Another nice feature is the ability to compare two or more profiling runs of the same program. This is useful during the iterative process of implementing code changes to ensure that the changes have the desired effect.
VQ obtains profiling information on dynamically loaded modules called from the target application at runtime. It runs the application in its address space and watches as it calls other modules. As long as the external function being called is associated with a shareable DLL, VQ can instrument it. (Fortunately, most DLLs and OCXs are shareable.) It does this by copying the module being called into the VQ process address space and inserting its measurement hooks into this copy of the code. Rational calls this technique Object Code Insertion, which it claims to have patented.
The first noticeable thing about
running Visual Quantify is how long it takes to get started. This is
because the process of intercepting dynamic program loads, loading a
private copy of the module into the VQ process address space, and
inserting the instrumentation hooks is quite lengthy. Commonly
accessed DLLs like MCVSRT50.dll
are normally resident in the system when a program begins execution
and do not have to be loaded. In the case of the
dmperfss program, VQ initialization took over 20
minutes before program execution was able to proceed unimpeded. VQ
keeps you entertained during this startup delay with two displays
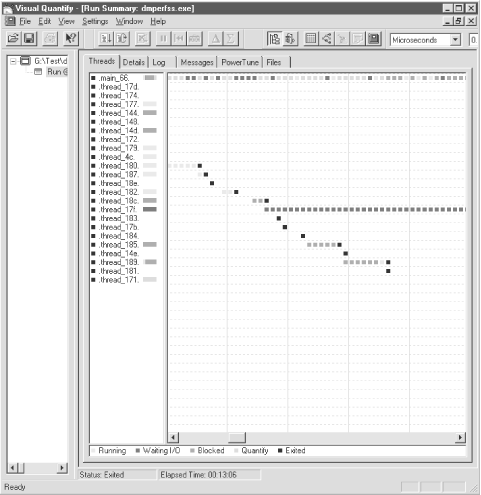
that show the progress of initialization. The Threads display,
illustrated in Figure 4-1, shows the status of the
profiling run. The Threads display is a histogram showing activity by
thread. We are not certain why so many threads are displayed
here—the application itself only has two, corresponding to
main_66 (top) and thread_17f (the grayish squares in the middle of
the screen). It seems plausible that VQ spawns a separate thread to
load each DLL. Gray squares in the main_66 thread indicate VQ delays
to load the modules and insert its hooks.
The Log display illustrated in Figure 4-2 is quite informative. VQ logs each load module as it encounters it in the course of program execution. Here we see dmperfss.exe being instrumented, followed by NetApi32.dll, MSVCRT.dll, NETRAP.dll, SAMLIB.dll, etc. When VQ encounters a module that it cannot instrument, like authperf.dll, a warning message is printed. Obviously, following the trail of the modules called from the main application program, loading them, and instrumenting them is very time-consuming. One of VQ’s execution-time options copies instrumented load modules to a disk cache. On subsequent VQ runs, the program checks first to see if a current copy of the load module is available from the disk cache, speeding up processing on subsequent profiling runs considerably.
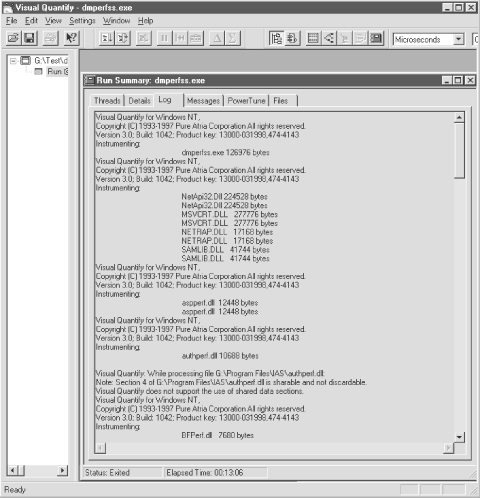
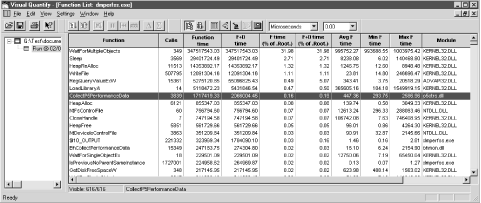
Figure 4-3, which displays the
dmperfss functions ordered by the amount of time
spent in execution, shows how effective VQ is in instrumenting
third-party code. Notice that the program is spending most of its
time in operating system runtime module. These include Timer waits
and waiting for other events to occur when the program is asleep
between collection intervals. Where the Microsoft VC++ profiler
collected data on 155 function calls, VQ provides data on 616. Eight
out of the first eleven modules are functions embedded in KERNEL32.dll. VQ shows precisely how long
these Win32 API calls take. The first dmperfss
function to make the list is $10_OUTPUT, which is responsible for
only 0.03% of the total execution time. The information VQ provides
changed our perspective from fine-tuning the code in
dmperfss to improving the way the code interacts
with Windows 2000 system services. Because it gathers all this
additional information, VQ’s intuitive user interface is even
more important. You can open several different windows at one time,
each focusing on a different segment of the program, and you can
navigate easily through the code execution path. The screen shots
here cannot do justice to just how well designed the interface is.
Of course, this added level of
information comes at a price in additional overhead. Notice that the
function call WaitForMultipleObjects accounts for 32% of the
execution time. This is the KERNEL32.dll function, which is called from
the WaitOnEvent routine located in dmwrdata.obj that the C++ profiler found was
consuming fully 87.5% of the time! Because of the measurement
overhead, it is important to accept VQ’s function timing
statistics as relative indicators of
performance, rather than absolute numbers. In other words, the
proportion of the time the dmperfss program spent
in WaitOnEvent compared to WriteDataToFile was consistent across the
MS VC++ profiler and VQ. We describe the effort made to validate the
measurements from all three sources later in this chapter.
The overhead associated with the VQ measurement technology was enough
of a factor to limit the types of program execution scenarios that we
could realistically gather performance information about. In
particular, we wanted to assess the impact of collecting different
Windows 2000 performance objects. The easiest way to do that was to
set up a data collection set that included all
available objects, overriding the program’s default collection
set to use the Master Collection set instead. However, when we ran VQ
with dmperfss collecting all available objects,
there was so much measurement overhead that we were unable to collect
data at frequent enough intervals to gather data in a systematic
fashion. We worked around the problem easily enough by creating
subsets of the program’s Master Collection set and analyzing
them. The overhead associated with VQ profiling is the one
consideration to be aware of when you are using the program and
interpreting its results.
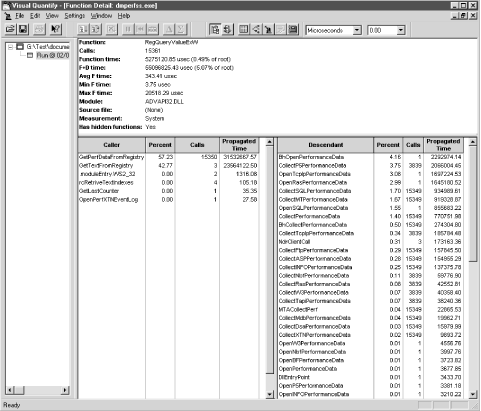
VQ excelled in illuminating the
execution path associated with the Win32 services that were routinely
called by the dmperfss program and were
responsible for much of the execution time. Figure 4-4 shows the Function Detail display obtained by
zooming in on the RegQueryValueEx function, which is the oldest and
most commonly used interface to collect performance data in Windows
2000. (For more information, refer back to Chapter 2.) The Function Detail screen displays the
program functions that called RegQueryValueEx and the functions
called from RegQueryValueEx. (You can navigate
back and forth in the Function Detail screen to trace the execution
path forward and back.) In the absence of the information VQ
provides, the interface to RegQueryValueEx is a black box. The calls
to RegQueryValueEx are well documented in the Win32 System
Development Kit (SDK). Microsoft also supplies a code sample in the
SDK that shows how to support extended counters across this
interface, but the actual program flow of control is not documented.
VQ opens up this black box so that we can get a good look
inside.
Performance objects in Windows 2000 are associated with a Perflib DLL
that responds to three function calls: Open, Close, and Collect.
Figure 4-5 illustrates the Registry entries that a
Perflib DLL must create. A performance monitor application like the
Windows 2000 System Monitor, the NT
Performance Monitor, or
dmperfss
scans the Windows 2000 Registry
looking for these entries in order to see what collection data is
available on a particular machine. The performance monitoring
application calls the Open function for the performance DLL initially
to enumerate the objects and counters that it can report. The Collect
function is then performed at regular intervals to retrieve data. The
metadata retrieved from the Open call is used to process the data
buffers retrieved by the Collect function. The Close function is used
to perform any necessary cleanup inside the Perflib DLL.
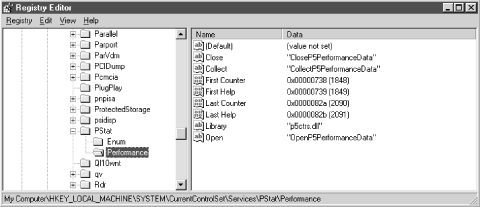
Figure 4-5. Performance subkeys under Services Registry key point to Perflib DLLs and their entry points for performance data collection
Figure 4-4 showed that RegQueryValueExW is called
from two places by dmperfss, 15,350 times from
GetPerfDataFromRegistry, and just three times from
GetTextFromRegistry. GetPerfDataFromRegistry is called from the
dmperfss data collection loop once an interval for
each performance object, while GetTextFromRegistry is called only at
initialization to retrieve the performance object metadata. Yet the
three initialization calls are almost as time-consuming as the
interval data collection calls, according to the VQ measurement data.
VQ then breaks down the time spent in RegQueryValueEx according to
the functions it calls, most of which are Open, Close, and Collect
calls embedded in Perflib DLLs. From the number of function calls
executed, we see a one-to-one correspondence between calls to
RegQueryValueEx and a number of Perflib DLL Collect functions. What
we found surprising was that functions like
CollectSQLPerformanceData, which is associated with the collection of
MS SQL Server performance data, were being called implicitly. MS SQL
Server was installed on this machine, but the
dmperfss program did not
explicitly reference the SQL Server performance objects.
As expected, the Perflib DLL Open calls are made just once. Several
of the Open calls are very time-consuming,
possibly due to serialization delays associated with interprocess
communication. But since the Open calls are made
just once, the time spent waiting for the Perflib DLL to initialize
is acceptable. (Besides, there is nothing we can do to improve
someone else’s code.)
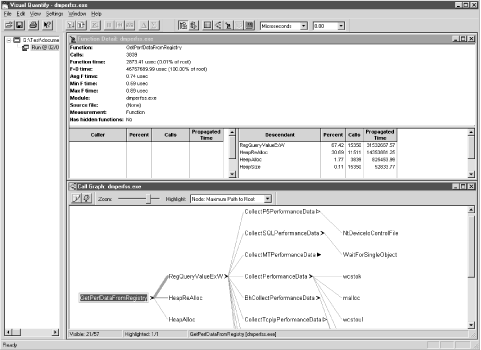
Figure 4-6 shows a view of the execution profile that VQ creates called the Call Graph. The Call Graph traces the subfunctions called from function GetPerfDataFromRegistry in the dmperfss.exe program. The thickness of the line connecting two functions represents relative amount of time spent traversing that particular logical path. This display clearly identifies the program’s critical path of execution, which is useful for zeroing in on what sections of code need work. Recall that with the Microsoft VC++ profiler, it was not possible to measure the execution time in any modules called from GetPerfDataFromRegistry because they were outside the range of the instrumented program. With VQ, you can see deeply into modules other than your own. In this instance, at least, we found the insight gained into the workings of these system interfaces extremely valuable. The program’s execution time profile gives us important information that is simply unavailable from any other documented source.
Overall, we gave the Rational Visual Quantify program very high marks in usability. It extends the execution time analysis so that you can look inside many system calls and interfaces. The user interface is exceptionally well designed, allowing the user to cope with all the additional information presented.
Intel’s VTune product is a CPU execution profiling tool aimed at helping the programmer create code that is optimized for Intel hardware. VTune samples systemwide activity using a methodology that runs off the hardware’s high priority clock interrupt. During clock interrupt processing, VTune figures out what process was executing immediately prior to the interrupt occurring. Then VTune maps the program counter for the thread that was running into the process virtual address space to figure out what module and code are being executed. Later, when it has finished collecting data, VTune post-processes the information to produce a detailed report on just about every routine running on the Windows 2000 system. Because the clock IRQ is such high priority (refer to the discussion of IRQ priority in Chapter 3), almost every Windows 2000 system routine is visible to VTune.
There are several distinct advantages to this approach. First of all,
it generates very low overhead. We made our first run with VTune
using the same setup as under VQ; the dmperfss
application was set to collect the default collection set once per
second. During this run, VTune identified that 90% of system activity
occurred in a module called Hal.dll. HAL is the hardware-specific Windows
2000 Hardware Abstraction Layer. Apparently, the code for the system
Idle thread, which Windows 2000 dispatches when there is no other
work for the system to perform, resides here.
We conclude that with the default collection set being harvested once per second, the system was cruising at less than 10% busy with VTune running. This highlights another advantage of VTune: namely, that the profiling program captures just about all system activity, even code executing inside the Windows 2000 operating system kernel and the HAL. Because these operating system modules are not shareable DLLs, they are not visible to tools like Visual Quantify. Finally, this measurement methodology is the only way to get good performance data on complex applications involving multiple process address spaces, interprocess communication, etc. In other words, VTune may be the best way to gain insight into web site applications that interact with back-end databases, or COM-based applications that run within the context of the Microsoft Transaction Server.
In reacting to the initial results reported by VTune, we decided it
would be helpful to try and accumulate more samples related to
dmperfss activity, and less involving the
operating system’s Idle thread function. Consequently, we
changed the collections parameters for dmperfss to
collect all available performance objects once per second. Remember
that under VQ, overhead considerations made it impractical to profile
the program under those circumstances. Using the more efficient,
timer-based VTune data collection mechanism, this scheme worked just
fine.
Figure 4-7 illustrates the available VTune output
reports. A Modules Report is shown from an interval where
dmperfss was executing, collecting the full Master
Collection set once per second during an approximately five-minute
interval. All the modules detected in execution during that interval
are listed on the left side of the chart in alphabetical order. The
chart is a histogram showing the amount of CPU time spent inside each
module. Each vertical bar represents 10% CPU consumption.
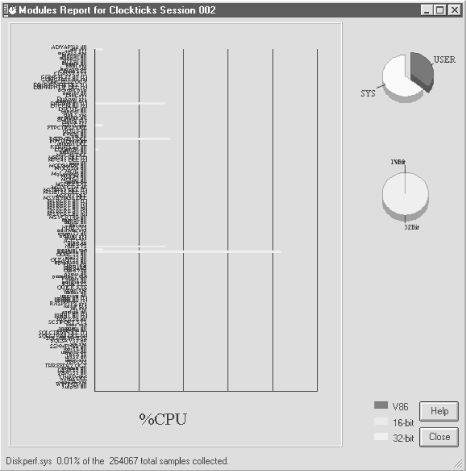
This VTune report is so detailed that it is quite hard to read. By clicking on a section of the chart, you can zoom in to see more detail; see Figure 4-8. There are no other sort options for this display, which also contributes to the difficulty in manipulating the display. Figure 4-8 zooms in on the portion of the chart where two modules consuming a good deal of CPU time are sorted together. These modules are operating system routines, ntdll.dll and ntoskrnl.exe. Neither of these was visible using any of the other profiling tools.
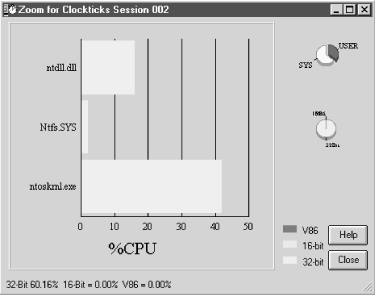
Figure 4-9 illustrates VTune’s ability to
zoom in on specific modules. This is a picture of the
dmperfss executable in virtual storage, showing
the code addresses where VTune detected activity, which are then
mapped to program modules. Here the interface is a bit more flexible,
with various sort options available for program hot-spot analysis. In
this view, modules are sorted by relative address in the load module.
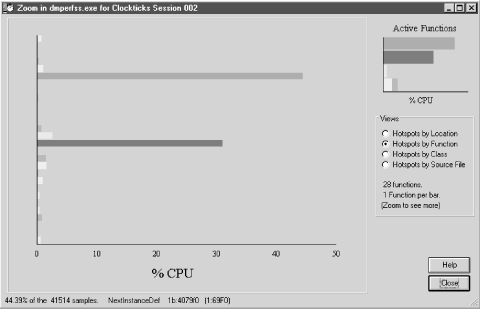
The VTune hotspot analysis identified two functions inside dmperfss that accounted for more than 70% of the activity inside the process address space. These two modules were NextInstanceDef and IsPreviousAndParentSameInstance. These VTune results correlate well with the original MS C++ profiler and VQ runs. MS C++ found high activity inside NextInstanceDef and FindPreviousObjectInstanceCounter, the parent function that calls IsPreviousAndParentSameInstance internally. VQ also identified IsPreviousAndParentSameInstance as one of the most heavily utilized modules with an extremely high number of function calls.
Figure 4-10 shows the detailed analysis VTune performed on the code being executed in the NextInstanceDef module. Here, execution time is mapped to the actual machine code generated by the C++ compiler. This is the area in which VTune stands above the crowd. There are six machine instructions associated with this routine, accounting for fully 44.39% of the CPU time consumed by the process. You can see how VTune breaks down the CPU consumption instruction by instruction. Making full use of the report output in Figure 4-10, we discovered, requires becoming familiar with the Pentium hardware and its performance characteristics. We will return to a discussion of this VTune report after an excursion into the realm of Intel Pentium and Pentium Pro hardware performance.
Get Windows 2000 Performance Guide now with the O’Reilly learning platform.
O’Reilly members experience books, live events, courses curated by job role, and more from O’Reilly and nearly 200 top publishers.

