Monitoring Performance
The Performance tab enables you to view the CPU, memory, and Ethernet usage in graphical form. This information is especially useful when you need a quick view of a CPU or memory performance bottleneck.
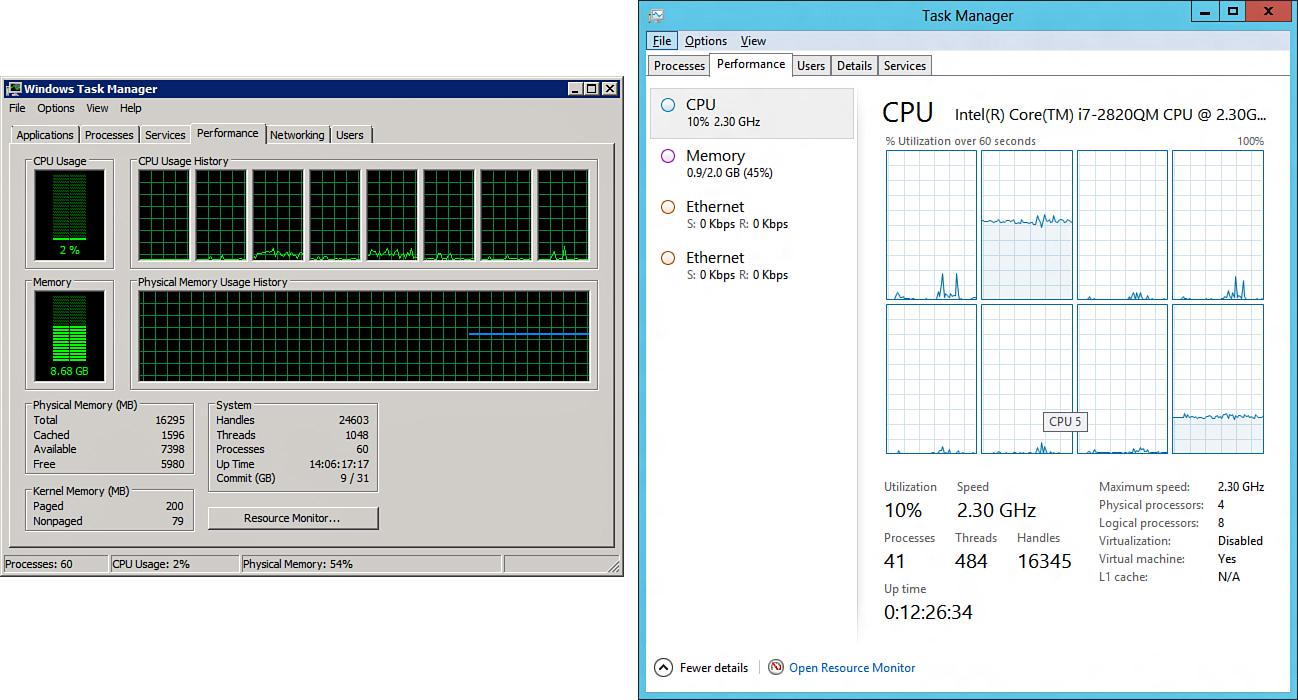
One of the most noticeably functionally enhanced tabs in Windows Server 2012, the Performance tab, now includes dynamic graphs, showing additional details for CPU, memory, disk, and Ethernet utilization. As seen in Figure 33.3, selecting an item in the left frame (CPU for example) produces details on utilization, speed, processes, threads, handles, and uptime in a detailed frame on the right side.

Figure 33.3. A side-by-side ...
Get Windows Server® 2012 Unleashed now with the O’Reilly learning platform.
O’Reilly members experience books, live events, courses curated by job role, and more from O’Reilly and nearly 200 top publishers.

