Invariably, you will encounter errors in your code. Design-time and compile-time errors are relatively easy to deal with because Word helps us out with error messages and by indicating the offending code. Logical errors are much more difficult to detect and to fix. This is where debugging plays a major role. The Word IDE provides some very powerful ways to find bugs.
Debugging can be quite involved, and I could include a whole chapter on the subject. There are even special software applications designed to assist in complex debugging tasks. However, for most purposes, a few simple techniques are sufficient. In particular, Word makes it easy to trace through programs, executing one line at a time, watching the effect of each line as it is executed.
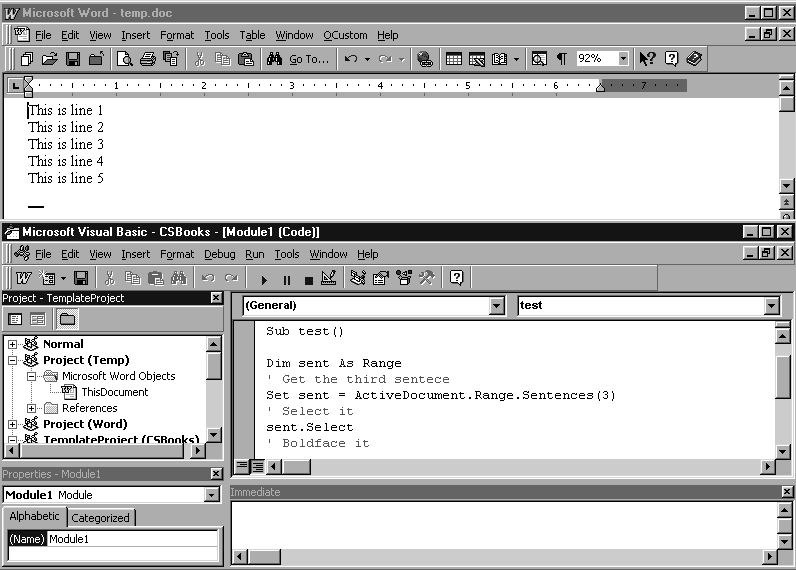
Try a very simple example, with which you should follow along on your PC. If possible, you should arrange your screen as in Figure 4-10. This will make it easier to follow the effects of the code, since you won’t need to switch back and forth between the Word window and the Word VBA window. The code that we will trace is shown in Example 4-1. (Note that lines beginning with an apostrophe are comments that are ignored by Word.)
Example 4-1. A Simple Program to Trace
Sub test()

Dim sent As Range
' Get the third sentence
Set sent = ActiveDocument.Range.Sentences(3)
' Select it
sent.Select
' Boldface it
sent.Bold = True
' Select the first character in the sentence
sent.Characters(1).Select
' Change the font
Selection.Font.Size = 24

End Sub
Begin by entering a paragraph containing at least three sentences into a Word document and leave the cursor anywhere in the document. When you finish, switch to the VBA IDE. Make sure that the code window is active and the insertion point is somewhere in the code. Then hit the F8 key once, which starts the tracing process. (You can also choose Step Into from the Debug menu.)
Continue striking the F8 key, pausing between keystrokes to view the effect of each instruction in the Word window. (You can toggle between Word and the IDE using Alt-F11.) As you trace through this code, you will see the third sentence selected, made bold, the first character selected, and finally its font size increased. Now you can begin to see what Word VBA programming is all about!
I will now examine some of the tools that Word provides for debugging code.
The process of executing code one line at a time, as I did in the previous example, is referred to as tracing or code stepping. Word provides three options related to tracing: stepping into, stepping over, and stepping out of. The differences between these methods refers to handling calls to other procedures.
To illustrate the difference, consider the code shown in Example 4-2. In ProcedureA, the first line of code sets the contents of the active Word document to the line “To be or not to be.” The second line calls ProcedureB and the third line boldfaces the contents of the active document. ProcedureB simply formats the first paragraph of the active Word document with the Heading 1 style. Don’t worry about the exact syntax of this code. The important thing to notice is that the second line of ProcedureA calls ProcedureB.
Example 4-2. Sample Code for Tracing Methods
Sub ProcedureA()
   ActiveDocument.Content.Text = "To be or not to be"
   Call ProcedureB
   ActiveDocument.Content.Bold = True
End Sub

Sub ProcedureB()
   Set para = ActiveDocument.Paragraphs(1)
   para.Style = "Heading 1"
End Sub
Step Into executes code one statement (or instruction) at a time. If the statement being executed calls another procedure, stepping into that statement simply transfers control to the first line in the called procedure. For instance, with reference to the previous code, stepping into the line:
Call ProcedureB
in ProcedureA transfers control to the first line of ProcedureB:
Set para = ActiveDocument.Paragraphs(1)
Further tracing proceeds in ProcedureB. Once all of the lines of ProcedureB have been traced, control returns to ProcedureA at the line immediately following the call to ProcedureB, that is, at the line:
ActiveDocument.Content.Bold = True
Step Into has another important use. Namely, if we choose Step Into while still in design mode—that is, before any code is running—execution begins but break mode is entered before the first line of code is actually executed. This is the proper way to begin tracing a program.
Step Over is similar to Step Into, except that if the current statement is a call to another procedure, the entire called procedure is executed without stopping (rather than tracing through the called procedure). Thus, for instance, stepping over the line:
Call ProcedureB
in the previous procedure executes ProcedureB and stops at the next line:
ActiveDocument.Content.Bold = True
in ProcedureA. This is useful if we are certain that ProcedureB is not the cause of our problem and we don’t want to trace through that procedure line by line.
Step Out is intended to be used within a called procedure (such as ProcedureB). Step Out executes the remaining lines of the called procedure and returns to the calling procedure (such as ProcedureA). This is useful if we are in the middle of a called procedure and decide that we don’t need to trace any more of that procedure, but want to return to the calling procedure. (If you trace into a called procedure by mistake, just do a Step Out to return to the calling procedure.)
If the Visual Basic Editor is in break mode, we may want to execute several lines of code at one time. This can be done using the Run To Cursor feature. Simply place the cursor on the statement immediately following the last line you want to execute and then press Ctrl-F8 (or choose Run To Cursor from the Debug menu).
We can also change the flow of execution while in break mode by placing the cursor on the statement that we want to execute next and hitting Ctrl-F9 or choosing Set Next Statement from the Debug menu. This will set the selected statement as the next statement to execute (but will not execute it until we continue tracing). What power!
It is often useful to watch the values of certain expressions or variables as we trace through a program. Word provides several ways to do this.
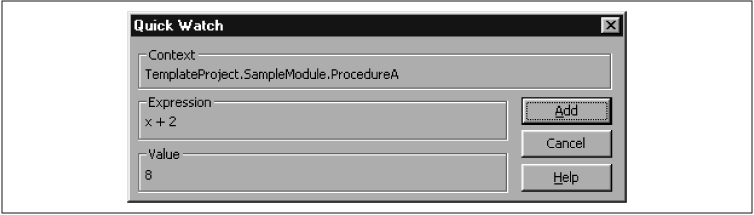
The Quick Watch feature is used to check the value of a variable or expression quickly while in break mode. Just place the insertion point over the variable name and hit Shift-F9 (or choose Quick Watch from the Debug menu). For instance, Figure 4-11 shows the Quick Watch dialog box when the expression x + 2 is selected in the code in Figure 4-12. According to Figure 4-11, at the time that Quick Watch was invoked, the expression x + 2 had the value 8. Note that if I had just placed the insertion point in front of the letter x, then Quick Watch would have reported the value of this variable alone.
Another way to get values for expressions or variables quickly is to enable Auto Data Tips on the Editor tab of in Word VBA’s Options dialog box. With this feature enabled, when we place the mouse pointer over a variable or select an expression and place the mouse pointer over the selection, after a slight delay, a small yellow window will appear containing the value of the variable or expresion. This is very useful!
Two special windows aid in watching expressions: the Locals window and the Watch window. These are shown in Figure 4-12.
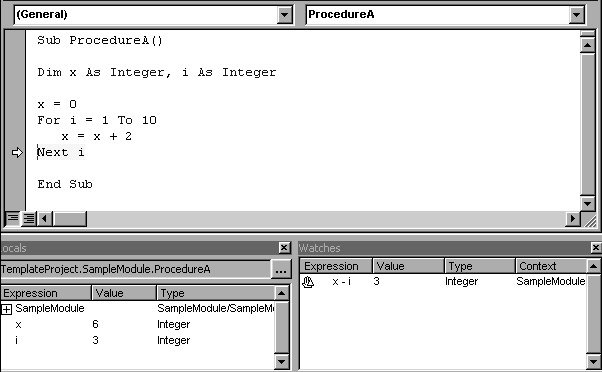
The Locals window shows the values of all local variables. A local variable is a variable defined within the current procedure and is therefore not valid in any other procedure. (I discuss local variables in Chapter 5, Variables, Data Types, and Constants.)
The Watch window shows all of the watches that have been set. A watch is a variable or expression that is placed in the Watch window. Word automatically updates the expressions in the Watch window after each line of code is executed and acts according to the type of watch defined, as described next.
To add a watch, choose Add Watch from the Debug menu. This will produce the dialog box shown in Figure 4-13.
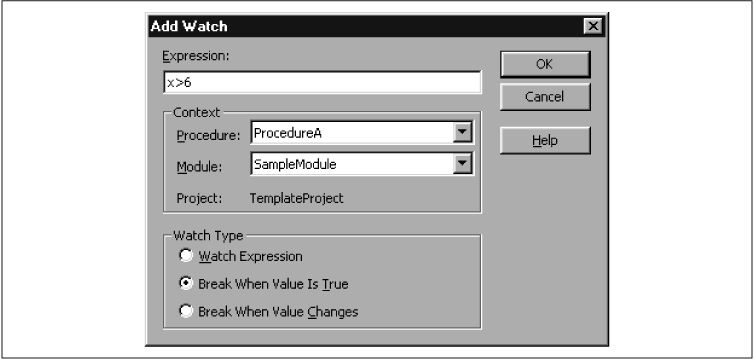
You can then enter a variable or expression, such as x > 6, in the Expression text box. Note that there are three types of watches:
Watch Expression simply adds the expression to the Watches window so you can watch its value as code is executed. In this example, the value of the expression will be either True or False, depending upon whether
x > 6or not.Break When Value Is True asks Word to stop execution and enter break mode whenever the expression is true. In this example, VBA will break execution when
x > 6is true, that is, whenxbecomes greater than6.Break When Value Changes asks Word to enter break mode when the value of the expression changes in any way (in this case, from True to False or vice-versa).
Altogether, the various tracing modes and watch types provide a very powerful set of tools for debugging code. I use them often!
Get Writing Word Macros, Second Edition now with the O’Reilly learning platform.
O’Reilly members experience books, live events, courses curated by job role, and more from O’Reilly and nearly 200 top publishers.

