2022 Cloud Salary Survey
Trends for Compensation, Remote Work, Training, and More
Last year, our report on cloud adoption concluded that adoption was proceeding rapidly; almost all organizations are using cloud services. Those findings confirmed the results we got in 2020: everything was “up and to the right.” That’s probably still true—but saying “everything is still up and to the right” would be neither interesting nor informative. So rather than confirming the same results for a third year, we decided to do something different.
This year’s survey asked questions about compensation for “cloud professionals”: the software developers, operations staff, and others who build cloud-based applications, manage a cloud platform, and use cloud services. We limited the survey to residents of the United States because salaries from different countries aren’t directly comparable; in addition to fluctuating exchange rates, there are different norms for appropriate compensation. This survey ran from April 4 through April 15, 2022, and was publicized via email to recipients of our Infrastructure & Ops Newsletter whom we could identify as residing in the United States or whose location was unknown.

Learn faster. Dig deeper. See farther.
Executive Summary
- Survey respondents earn an average salary of $182,000.
- The average salary increase over the past year was 4.3%.
- 20% of respondents reported changing employers in the past year.
- 25% of respondents are planning to change employers because of compensation.
- The average salary for women is 7% lower than the average salary for men.
- 63% of respondents work remotely all the time; 94% work remotely at least one day a week.
- Respondents who participated in 40 or more hours of training in the past year received higher salary increases.
Of the 1,408 responses we initially received, 468 were disqualified. Respondents were disqualified (and the survey terminated) if the respondent said they weren’t a US resident or if they were under 18 years old; respondents were also disqualified if they said they weren’t involved with their organization’s use of cloud services. Another 162 respondents filled out part of the survey but didn’t complete it; we chose to include only complete responses. That left us with 778 responses. Participants came from 43 states plus Washington, DC. As with our other surveys, the respondents were a relatively senior group: the average age was 47 years old, and while the largest number identified themselves as programmers (43%), 14% identified as executives and 33% as architects.
The Big Picture
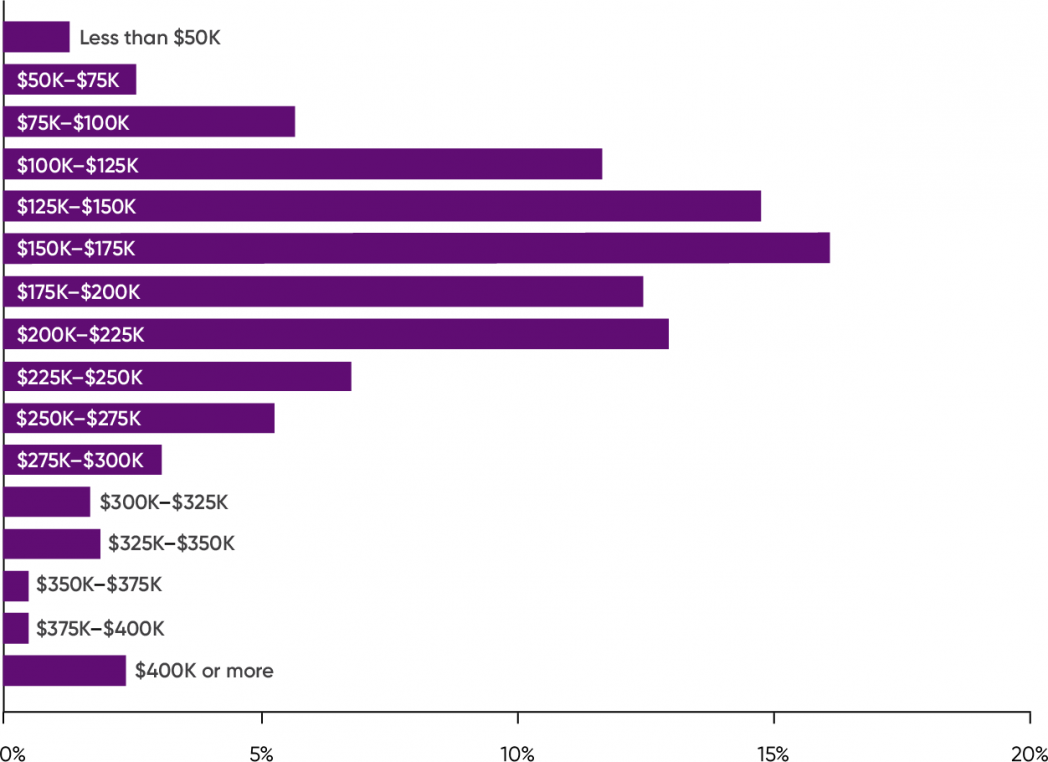
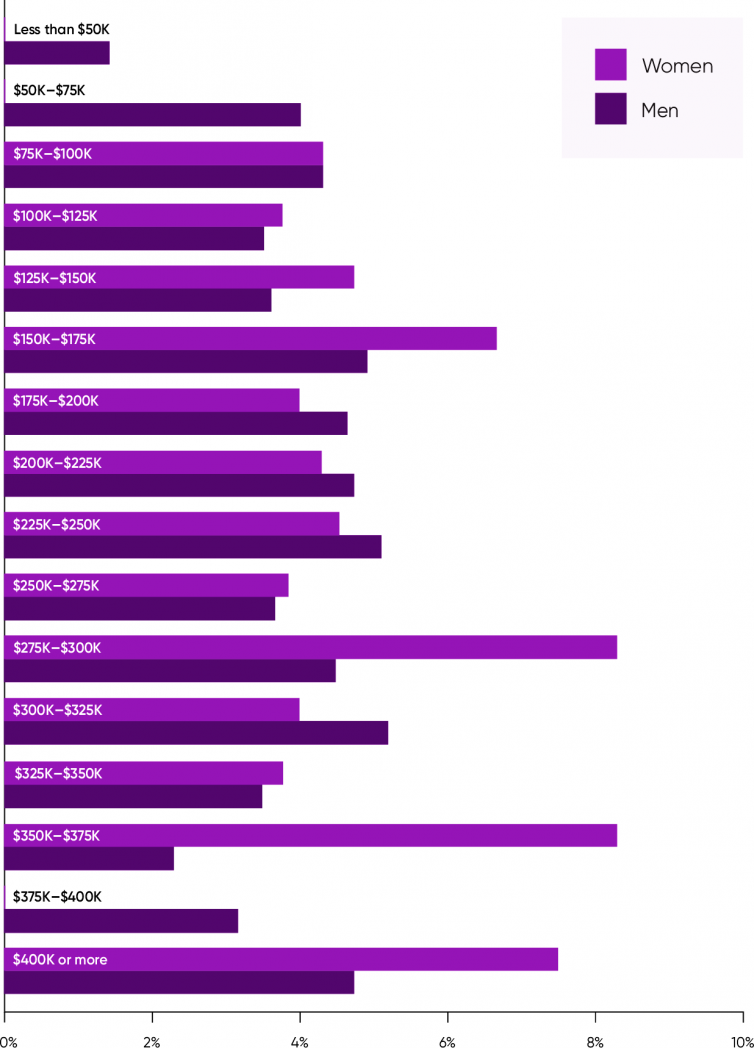
Cloud professionals are well paid. That’s not a surprise in itself. We expected salaries (including bonuses) to be high, and they were. The cloud professionals who responded to our survey earn an average salary of $182,000; the most common salary range among respondents was $150,000 to $175,000 per year (16% of the total), as shown in Figure 1. The peak was fairly broad: 68% of the respondents earn between $100,000 and $225,000 per year. And there was a significant “long tail” in the compensation stratosphere: 7% of the respondents earn over $300,000 per year, and 2.4% over $400,000 per year.
We believe that job changes are part of what’s driving high salaries. After all, we’ve heard about talent shortages in almost every field, with many employers offering very high salaries to attract the staff they need. By staying with their current employer, an employee may get an annual salary increase of 4%. But if they change jobs, they might get a significantly higher offer—20% or more—plus a signing bonus.
20% of the respondents reported that they changed employers in the past year. That number isn’t high in and of itself, but it looks a lot higher when you add it to the 25% who are planning to leave jobs over compensation. (Another 20% of the respondents declined to answer this question.) It’s also indicative that 19% of the respondents received promotions. There was some overlap between those who received promotions and those who changed jobs (5% of the total said “yes” to both questions, or roughly one quarter of those who changed jobs). When you look at the number of respondents who left their employer, are planning to leave their employer, or got a promotion and a salary increase, it’s easy to see why salary budgets are under pressure. Right now, qualified candidates have the power in the job market, though with the stock market correction that began in March 2022 and significant layoffs from some large technology-sector companies, that may be changing.
These conclusions are borne out when you look at the salaries of those who were promoted, changed jobs, or intend to change jobs. A promotion roughly doubled respondents’ year-over-year salary increase. On the average, those who were promoted received a 7% raise; those who weren’t promoted received a 3.7% increase. The result was almost exactly the same for those who changed jobs: those who changed averaged a 6.8% salary increase, while those who remained averaged 3.7%. We also see a difference in the salaries of those who intend to leave because of compensation: their average salary is $171,000, as opposed to $188,000 for those who didn’t plan to leave. That’s a $17,000 difference, or roughly 10%.
Salaries by Gender
One goal of this survey was to determine whether women are being paid fairly. Last year’s salary survey for data and AI found a substantial difference between men’s and women’s salaries: women were paid 16% less than men. Would we see the same here?
The quick answer is “yes,” but the difference was smaller. Average salaries for women are 7% lower than for men ($172,000 as opposed to $185,000). But let’s take a step back before looking at salaries in more detail. We asked our respondents what pronouns they use. Only 8.5% said “she,” while 79% chose “he.” That’s still only 87% of the total. Where are the rest? 12% preferred not to say; this is a larger group than those who used “she.” 0.5% chose “other,” and 0.7% chose “they.” (That’s only four and six respondents, respectively.) Compared to results from our survey on the data/AI industry, the percentage of cloud professionals who self-identified as women appears to be much smaller (8.5%, as opposed to 14%). But there’s an important difference between the surveys: “I prefer not to answer” wasn’t an option for the Data/AI Salary Survey. We can’t do much with those responses. When we eyeballed the data for the “prefer not to say” group, we saw somewhat higher salaries than for women, but still significantly less (5% lower) than for men.
The difference between men’s and women’s salaries is smaller than we expected, given the results of last year’s Data/AI Salary Survey. But it’s still a real difference, and it begs the question: Is compensation improving for women? Talent shortages are driving compensation up in many segments of the software industry. Furthermore, the average reported salaries for both men and women in our survey are high. Again, is that a consequence of the talent shortage? Or is it an artifact of our sample, which appears to be somewhat older, and rich in executives? We can’t tell from a single year’s data, and the year-over-year comparison we made above is based on a different industry segment. But the evidence suggests that the salary gap is closing, and progress is being made. And that is indeed a good thing.
Salaries for respondents who answered “other” to the question about the pronouns they use are 31% lower than salaries for respondents who chose “he.” Likewise, salaries for respondents who chose “they” are 28% lower than men’s average salaries. However, both of these groups are extremely small, and in both groups, one or two individuals pulled the averages down. We could make the average salaries higher by calling these individuals “outliers” and removing their data; after all, outliers can have outsized effects on small groups. That’s a step we won’t take. Whatever the reason, the outliers are there; they’re part of the data. Professionals all across the spectrum have low-paying jobs—sometimes by choice, sometimes out of necessity. Why does there appear to be a concentration of them among people who don’t use “he” or “she” as their pronouns? The effect probably isn’t quite as strong as our data indicates, but we won’t try to explain our data away. It’s certainly indicative that the groups that use “they” or another pronoun than “he” or “she” showed a salary penalty. We have to conclude that respondents who use nonbinary pronouns earn lower salaries, but without more data, we don’t know why, nor do we know how much lower their salaries are or whether this difference would disappear with a larger sample.
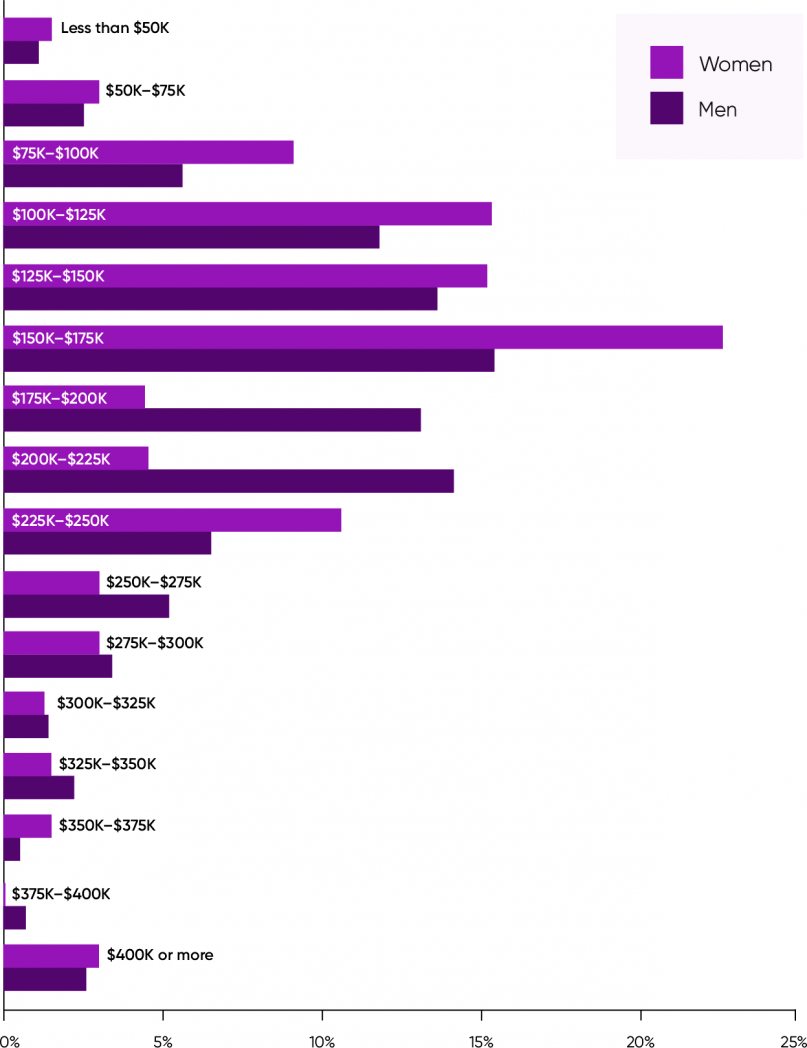
To see more about the differences between men’s and women’s salaries, we looked at the men and women in each salary range. The overall shapes of the salary distributions are clear: a larger percentage of women earn salaries between $0 and $175,000, and (with two exceptions) a larger percentage of men earn salaries over $175,000. However, a slightly larger percentage of women earn supersize salaries ($400,000 or more), and a significantly larger percentage earn salaries between $225,000 and $250,000 (Figure 2).
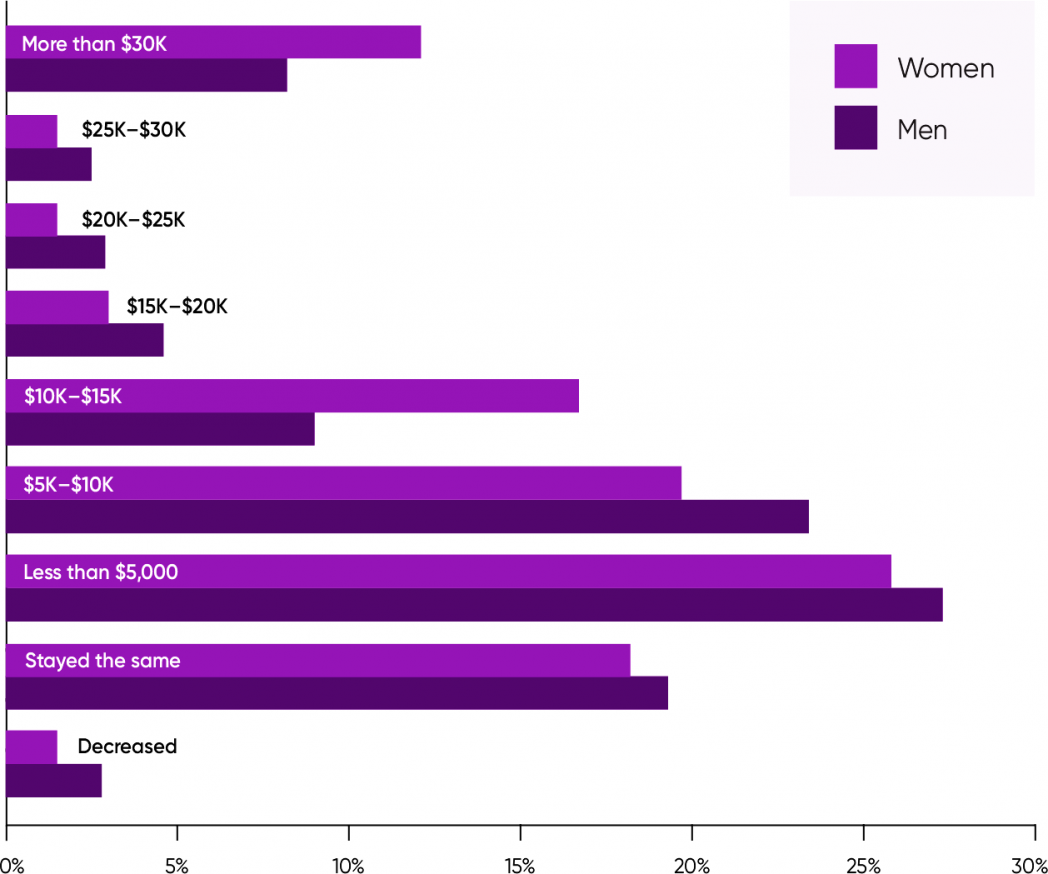
We can get some additional information by looking at salary increases (Figure 3). On average, women’s salary increases were higher than men’s: $9,100 versus $8,100. That doesn’t look like a big difference, but it’s over 10%. We can read that as a sign that women’s salaries are certainly catching up. But the signals are mixed. Men’s salaries increased more than women’s in almost every segment, with two big exceptions: 12% of women received salary increases over $30,000, while only 8% of men did the same. Likewise, 17% of women received increases between $10,000 and $15,000, but only 9% of men did. These differences might well disappear with more data.
When we look at salary increases as a percentage of salary, we again see mixed results (Figure 4). Women’s salary increases were much larger than men’s in three bands: over $325,000 (with the exception of $375,000–$400,000, where there were no women respondents), $275,000–$300,000, and $150,000–$175,000. For those with very large salaries, women’s salary increases were much higher than men’s. Furthermore, the $150,000–$175,000 band had the largest number of women. While there was a lot of variability, salary increases are clearly an important factor driving women’s salaries toward parity with men’s.
The Effect of Education
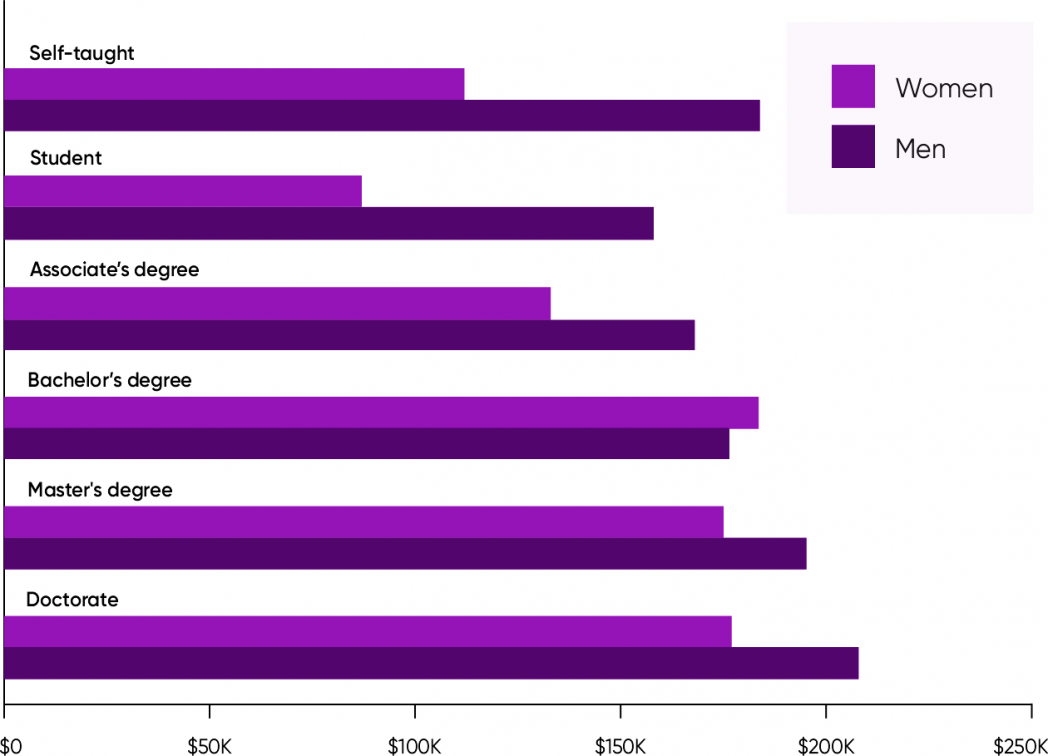
The difference between men’s and women’s salaries is significant at almost every educational level (Figure 5). The difference is particularly high for respondents who are self-taught, where women earned 39% less ($112,000 versus $184,000), and for students (45% less, $87,000 versus $158,000). However, those were relatively small groups, with only two women in each group. It’s more important that for respondents with bachelor’s degrees, women’s salaries were 4% higher than men’s ($184,000 versus $176,000)—and this was the largest group in our survey. For respondents with advanced degrees, women with doctorates averaged a 15% lower salary than men with equivalent education; women with master’s degrees averaged 10% lower. The difference between women’s and men’s salaries appears to be greatest at the extremes of the educational spectrum.
Salaries by State
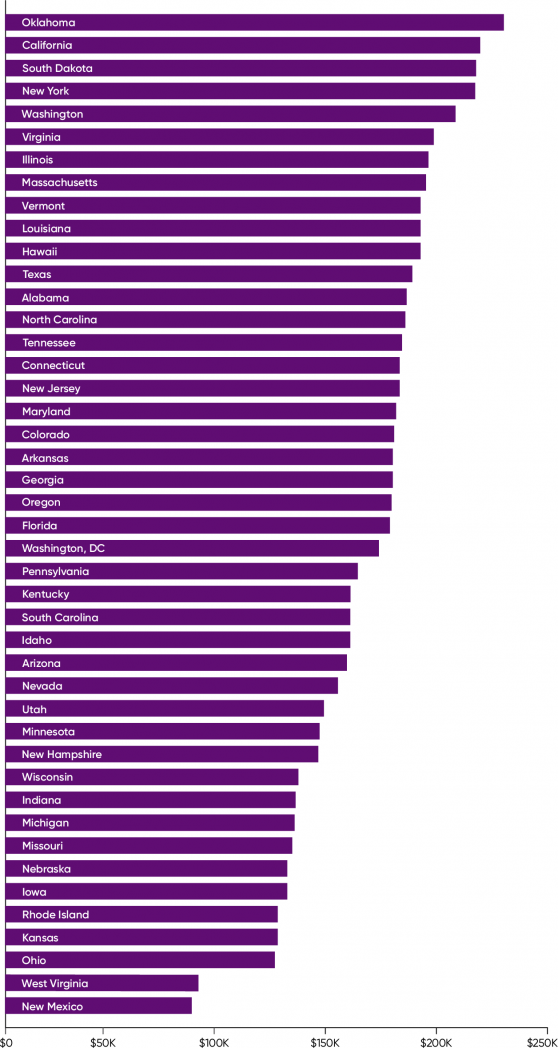
Participants in the survey come from 43 states plus Washington, DC. Looking at salaries by state creates some interesting puzzles. The highest salaries are found in Oklahoma; South Dakota is third, following California. And the top of the list is an interesting mix of states where we expected high salaries (like New York) and states where we expected salaries to be lower. So what’s happening?
The average salary from Oklahoma is $225,000—but that only reflects two respondents, both of whom work remotely 100% of the time. (We’ll discuss remote work later in this report.) Do they work for a Silicon Valley company and get a Silicon Valley salary? We don’t know, but that’s certainly a possibility. The average salary for South Dakota is $212,000, but we shouldn’t call it an “average,” because we only had one response, and this respondent reported working remotely 1–4 days per week. Likewise, Vermont had a single respondent, who works remotely and who also had an above-average salary. Many other states have high average salaries but a very small number of respondents.
So the first conclusion that we can draw is that remote work might be making it possible for people in states without big technology industries to get high salaries. Or it could be the opposite: there’s no state without some businesses using the cloud, and the possibility of remote work puts employers in those states in direct competition with Silicon Valley salaries: they need to pay much higher salaries to get the expertise they need. And those job offers may include the opportunity to work remotely full or part time—even if the employer is local. Both of those possibilities no doubt hold true for individuals, if not for geographical regions as a whole.
Outliers aside, salaries are highest in California ($214,000), New York ($212,000), Washington ($203,000), Virginia ($195,000), and Illinois ($191,000). Massachusetts comes next at $189,000. At $183,000, average salaries in Texas are lower than we’d expect, but they’re still slightly above the national average ($182,000). States with high average salaries tended to have the largest numbers of respondents—with the important exceptions that we’ve already noted. The lowest salaries are found in West Virginia ($87,000) and New Mexico ($84,000), but these reflected a small number of respondents (one and four, respectively). These two states aside, the average salary in every state was over $120,000 (Figure 6).
So, is remote work equalizing salaries between different geographical regions? It’s still too early to say. We don’t think there will be a mass exodus from high-salary states to more rural states, but it’s clear that professionals who want to make that transition can, and that companies that aren’t in high-salary regions will need to offer salaries that compete in the nationwide market. Future surveys will tell us whether this pattern holds true.
Salaries by Age
The largest group of respondents to our survey were between 45 and 54 years old (Figure 7). This group also had the highest average salary ($196,000). Salaries for respondents between 55 and 65 years old were lower (averaging $173,000), and salaries dropped even more for respondents over 65 ($139,000). Salaries for the 18- to 24-year-old age range were low, averaging $87,000. These lower salaries are no surprise because this group includes both students and those starting their first jobs after college.
It’s worth noting that our respondents were older than we expected; 29% were between 35 and 44 years old, 36% were between 45 and 54, and 22% were between 55 and 64. Data from our learning platform shows that this distribution isn’t indicative of the field as a whole, or of our audience. It may be an artifact of the survey itself. Are our newsletter readers older, or are older people more likely to respond to surveys? We don’t know.
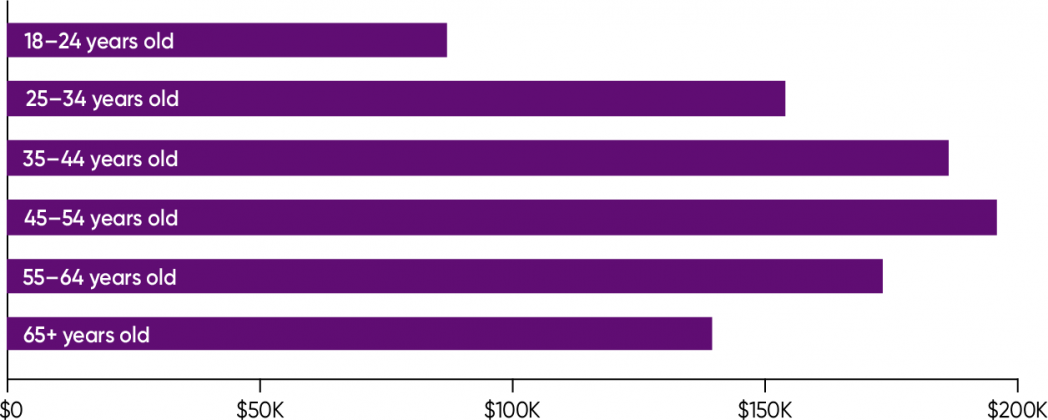
The drop in salaries after age 55 is surprising. Does seniority count for little? It’s easy to make hypotheses: Senior employees are less likely to change jobs, and we’ve seen that changing jobs drives higher salaries. But it’s also worth noting that AWS launched in 2002, roughly 20 years ago. People who are now 45 to 54 years old started their careers in the first years of Amazon’s rollout. They “grew up” with the cloud; they’re the real cloud natives, and that appears to be worth something in today’s market.
Job Titles and Roles
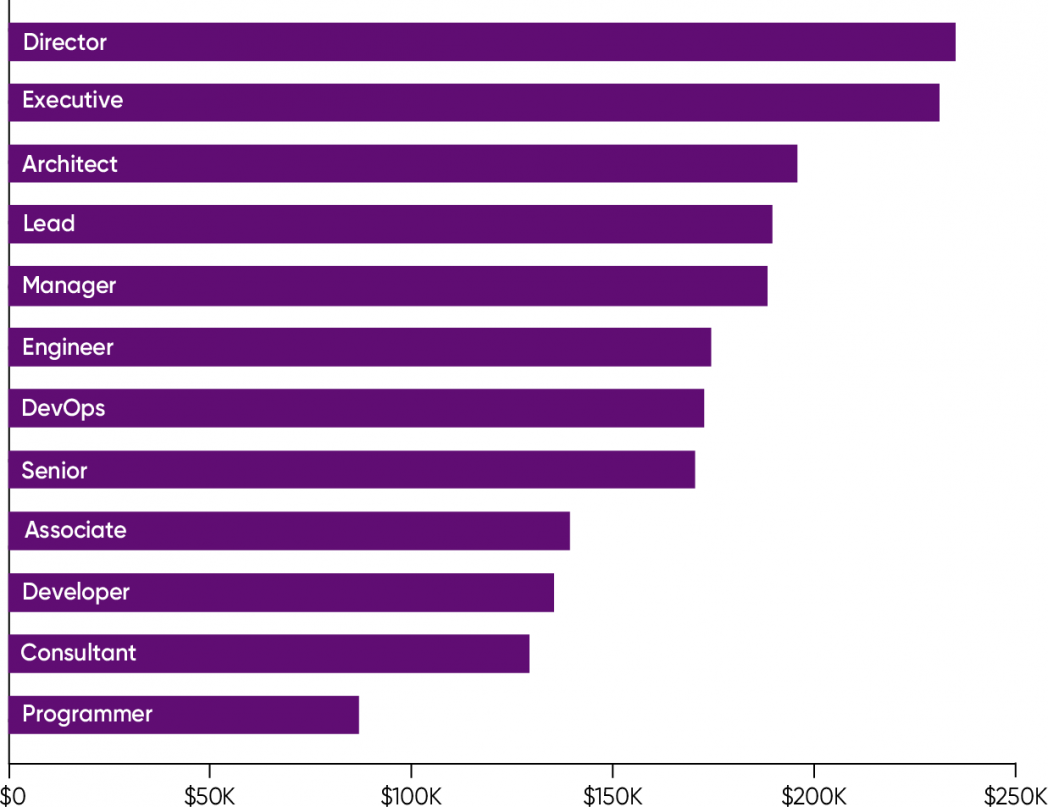
Job titles are problematic. There’s no standardized naming system, so a programming lead at one company might be an architect or even a CTO at another. So we ask about job titles at a fairly high level of abstraction. We offered respondents a choice of four “general” roles: executive, director, manager, or associate. We also allowed respondents to write in their own job titles; roughly half chose this option. The write-in titles were more descriptive and, as expected, inconsistent. We were able to group them into some significant clusters by looking for people whose write-in title used the words “engineer,” “programmer,” “developer,” “architect,” “consultant,” or “DevOps.” We also looked at two modifiers: “senior” and “lead.” There’s certainly room for overlap: someone could be a “senior DevOps engineer.” But in practice, overlap was small. (For example, no respondents used both “developer” and “architect” in a write-in job title.) There was no overlap between the titles submitted by respondents and the general titles we offered on the survey: our respondents had to choose one or the other.
So what did we see? As shown in Figure 8, the highest salaries go to those who classified themselves as directors ($235,000) or executives ($231,000). Salaries for architects, “leads,” and managers are on the next tier ($196,000, $190,000, and $188,000, respectively). People who identified as engineers earn slightly lower salaries ($175,000). Associates, a relatively junior category, earn an average of $140,000 per year. Those who used “programmer” in their job title are a puzzle. There were only three of them, which is a surprise in itself, and all have salaries in the $50,000 to $100,000 range (average $86,000). Consultants also did somewhat poorly, with an average salary of $129,000.
Those who identified as engineers (19%) made up the largest group of respondents, followed by associates (18%). Directors and managers each comprised 15% of the respondents. That might be a bias in our survey, since it’s difficult to believe that 30% of cloud professionals have directorial or managerial roles. (That fits the observation that our survey results may skew toward older participants.) Architects were less common (7%). And relatively few respondents identified themselves with the terms “DevOps” (2%), “consultant” (2%), or “developer” (2%). The small number of people who identify with DevOps is another puzzle. It’s often been claimed that the cloud makes operations teams unnecessary; “NoOps” shows up in discussions from time to time. But we’ve never believed that. Cloud deployments still have a significant operational component. While the cloud may allow a smaller group to oversee a huge number of virtual machines, managing those machines has become more complex—particularly with cloud orchestration tools like Kubernetes.
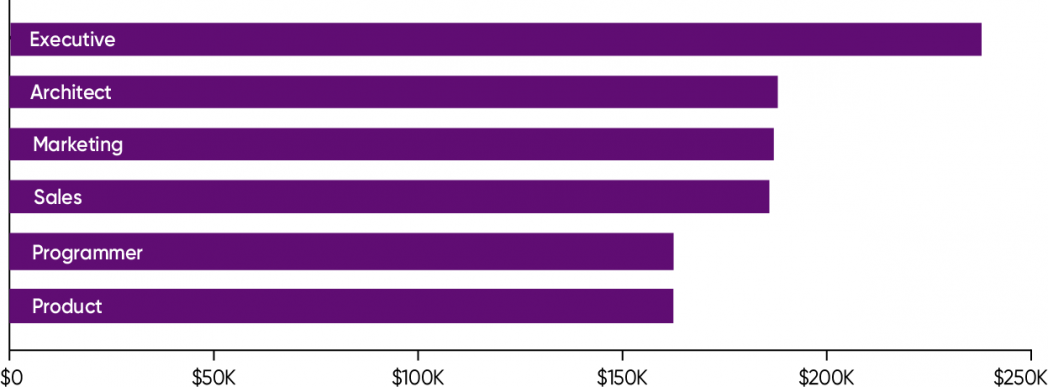
We also tried to understand what respondents are doing at work by asking about job roles, decoupling responsibilities from titles (Figure 9). So in another question, we asked respondents to choose between marketing, sales, product, executive, programmer, and architect roles, with no write-in option. Executives earn the highest salaries ($237,000) but were a relatively small group (14%). Architects are paid $188,000 per year on average; they were 33% of respondents. And for this question, respondents didn’t hesitate to identify as programmers: this group was the largest (43%), with salaries somewhat lower than architects ($163,000). This is roughly in agreement with the data we got from job titles. (And we should have asked about operations staff. Next year, perhaps.)
The remaining three groups—marketing, sales, and product—are relatively small. Only five respondents identified their role as marketing (0.6%), but they were paid well ($187,000). 1.5% of the respondents identified as sales, with an average salary of $186,000. And 8% of the respondents identified themselves with product, with a somewhat lower average salary of $162,000.
Working from Home
When we were planning this survey, we were very curious about where people worked. Many companies have moved to a fully remote work model (as O’Reilly has), and many more are taking a hybrid approach. But just how common is remote work? And what consequences does it have for the employees who work from home rather than in an office?
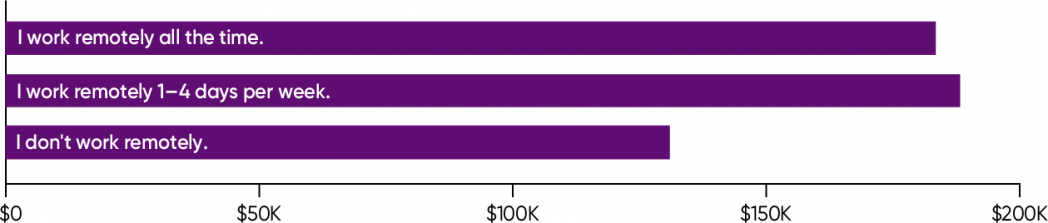
It turns out that remote work is surprisingly widespread (Figure 10). We found that only 6% of respondents answered no to the question “Do you work remotely?” More than half (63%) said that they work remotely all the time, and the remainder (31%) work remotely 1–4 days per week.
Working remotely is also associated with higher salaries: the average salary for people who work remotely 1–4 days a week is $188,000. It’s only slightly less ($184,000) for people who work remotely all the time. Salaries are sharply lower for people who never work remotely (average $131,000).
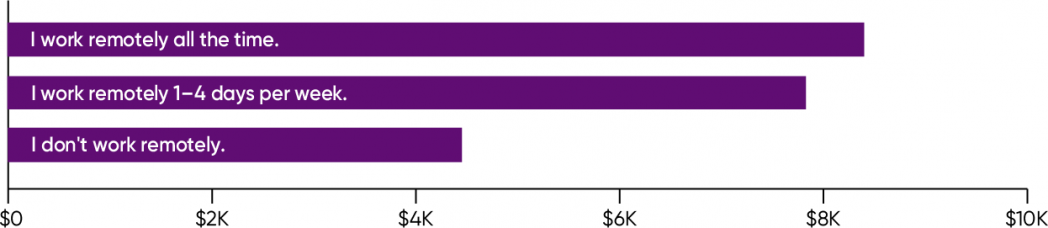
Salary increases show roughly the same pattern (Figure 11). While salaries are slightly higher for respondents who occasionally work in the office, salary increases were higher for those who are completely remote: the average increase was $8,400 for those who are remote 100% of the time, while those who work from home 1–4 days per week only averaged a $7,800 salary increase. We suspect that given time, these two groups would balance out. Salary changes for those who never work remotely were sharply lower ($4,500).
Of all jobs in the computing industry, cloud computing is probably the most amenable to remote work. After all, you’re working with systems that are remote by definition. You’re not reliant on your own company’s data center. If the application crashes in the middle of the night, nobody will be rushing to the machine room to reboot the server. A laptop and a network connection are all you need.
We’re puzzled by the relatively low salaries and salary increases for those who never work remotely. While there were minor differences, as you’d expect, there were no “smoking guns”: no substantial differences in education or job titles or roles. Does this difference reflect old-school companies that don’t trust their staff to be productive at home? And do they pay correspondingly lower salaries? If so, they’d better be forewarned: it’s very easy for employees to change jobs in the current labor market.
As the pandemic wanes (if indeed it wanes—despite what people think, that’s not what the data shows), will companies stick with remote work or will they require employees to come back to the office? Some companies have already asked their employees to return. But we believe that the trend toward remote work will be hard, if not impossible, to reverse, especially in a job market where employers are competing for talent. Remote work certainly raises issues about onboarding new hires, training, group dynamics, and more. And it’s not without problems for the employees themselves: childcare, creating appropriate work spaces, etc. These challenges notwithstanding, it’s difficult to imagine people who have eliminated a lengthy commute from their lives going back to the office on a permanent basis.
Certifications and Training
Nearly half (48%) of our respondents participated in technical training or certification programs in the last year. 18% of them obtained one or more certifications, suggesting that 30% participated in training or some other form of professional development that wasn’t tied to a certification program.
The most common reasons for participating in training were learning new technologies (42%) and improving existing skills (40%). (Percentages are relative to the total number of respondents, which was 778.) 21% wanted to work on more interesting projects. The other possible responses were chosen less frequently: 9% of respondents wanted to move into a leadership role, and 12% were required to take training. Job security was an issue for 4% of the respondents, a very small minority. That’s consistent with our observation that employees have the upper hand in the labor market and are more concerned with advancement than with protecting their status quo.
Survey participants obtained a very broad range of certifications. We asked specifically about 11 cloud certifications that we identified as being particularly important. Most were specific to one of the three major cloud vendors: Microsoft Azure, Amazon Web Services, and Google Cloud. However, the number of people who obtained any specific certification was relatively small. The most popular certifications were AWS Certified Cloud Practitioner and Solutions Architect (both 4% of the total number of respondents). However, 8% of respondents answered “other” and provided a write-in answer. That’s 60 respondents—and we got 55 different write-ins. Obviously, there was very little duplication. The only submissions with multiple responses were CKA (Certified Kubernetes Administrator) and CKAD (Certified Kubernetes Application Developer). The range of training in this “other” group was extremely broad, spanning various forms of Agile training, security, machine learning, and beyond. Respondents were pursuing many vendor-specific certifications, and even academic degrees. (It’s worth noting that our 2021 Data/AI Salary Surveyreport also concluded that earning a certification for one of the major cloud providers was a useful tool for career advancement.)
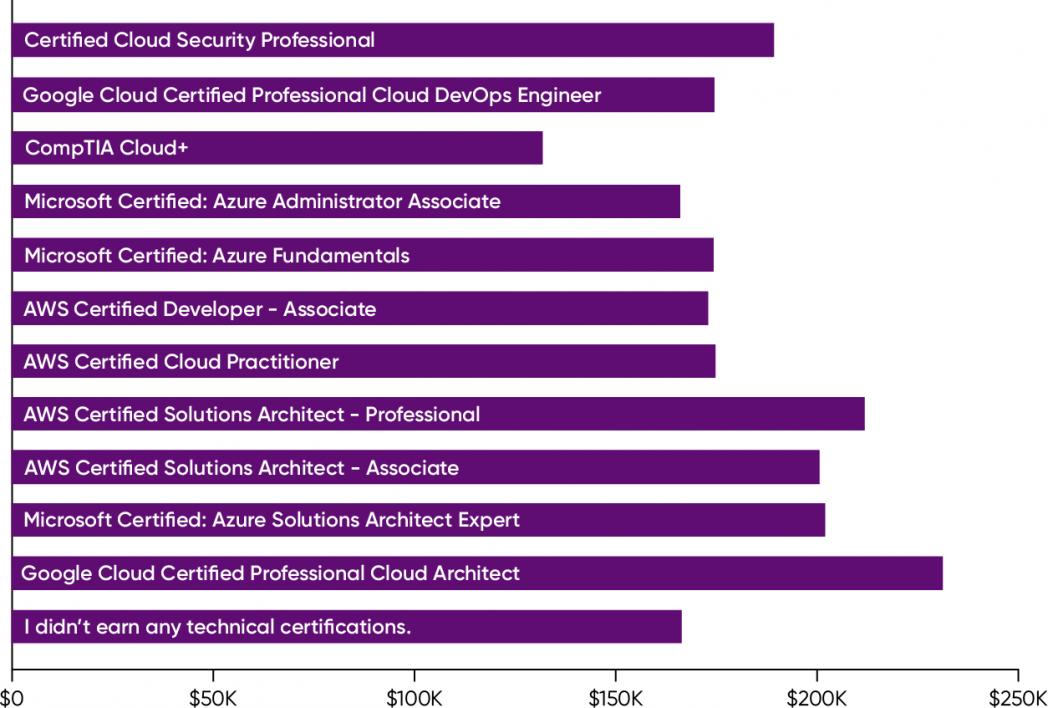
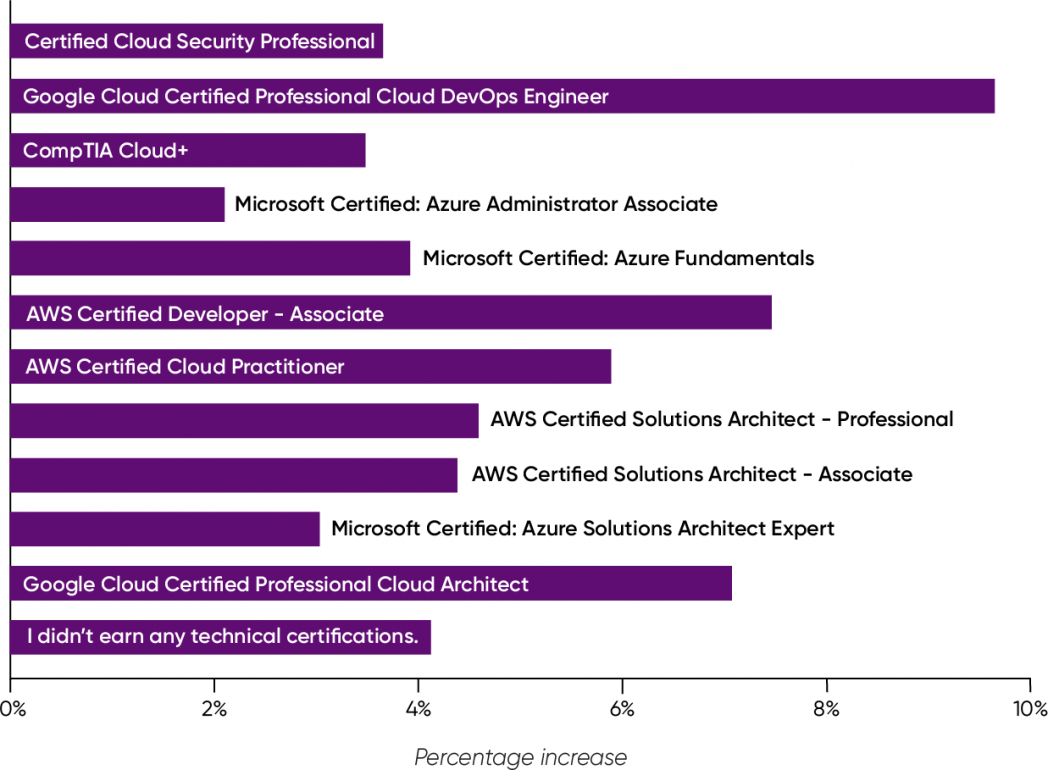
Given the number of certifications that are available, this isn’t surprising. It’s somewhat more surprising that there isn’t any consensus on which certifications are most important. When we look at salaries, though, we see some signals…at least among the leading certifications. The largest salaries are associated with Google Cloud Certified Professional Cloud Architect ($231,000). People who earned this certification also received a substantial salary increase (7.1%). Those who obtained an AWS Certified Solutions Architect – Professional, AWS Certified Solutions Architect – Associate, or Microsoft Certified: Azure Solutions Architect Expert certification also earn very high salaries ($212,000, $201,000, and $202,000, respectively), although these three received smaller salary increases (4.6%, 4.4%, and 4.0%, respectively). Those who earned the CompTIA Cloud+ certification receive the lowest salary ($132,000) and got a relatively small salary increase (3.5%). The highest salary increase went to those who obtained the Google Cloud Certified Professional Cloud DevOps Engineer certification (9.7%), with salaries in the middle of the range ($175,000).
We can’t draw any conclusions about the salaries or salary increases corresponding to the many certifications listed among the “other” responses; most of those certifications only appeared once. But it seems clear that the largest salaries and salary increases go to those who are certified for one of the big three platforms: Google Cloud, AWS, and Microsoft Azure (Figures 12 and 13).
The salaries and salary increases for the two Google certifications are particularly impressive. Given that Google Cloud is the least widely used of the major platforms, and that the number of respondents for these certifications was relatively small, we suspect that talent proficient with Google’s tools and services is harder to find and drives the salaries up.
Our survey respondents engaged in many different types of training. The most popular were watching videos and webinars (41%), reading books (39%), and reading blogs and industry articles (34%). 30% of the respondents took classes online. Given the pandemic, it isn’t at all surprising that only 1.7% took classes in person. 23% attended conferences, either online or in person. (We suspect that the majority attended online.) And 24% participated in company-offered training.
There’s surprisingly little difference between the average salaries associated with each type of learning. That’s partly because respondents were allowed to choose more than one response. But it’s also notable that the average salaries for most types of learning are lower than the average salary for the respondents as a whole. The average salary by type of learning ranges from $167,000 (in-person classes) to $184,000 (company-provided educational programs). These salaries are on the low side compared to the overall average of $182,000. Lower salaries may indicate that training is most attractive to people who want to get ahead in their field. This fits the observation that most of the people who participated in training did so to obtain new skills or to improve current ones. After all, to many companies “the cloud” is still relatively new, and they need to retrain their current workforces.
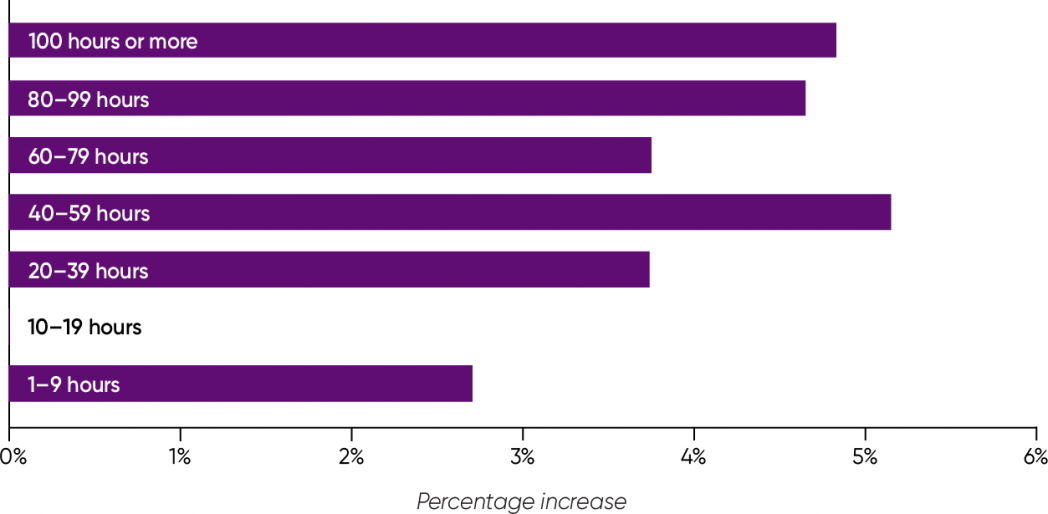
When we look at the time that respondents spent in training (Figure 14), we see that the largest group spent 20–39 hours in the past year (13% of all the respondents). 12% spent 40–59 hours; and 10% spent over 100 hours. No respondents reported spending 10–19 hours in training. (There were also relatively few in the 80–99 hour group, but we suspect that’s an artifact of “bucketing”: if you’ve taken 83 hours of training, you’re likely to think, “I don’t know how much time I spent in training, but it was a lot,” and choose 100+.) The largest salary increases went to those who spent 40–59 hours in training, followed by those who spent over 100 hours; the smallest salary increases, and the lowest salaries, went to those who only spent 1–9 hours in training. Managers take training into account when planning compensation, and those who skimp on training shortchange themselves.
The Cloud Providers
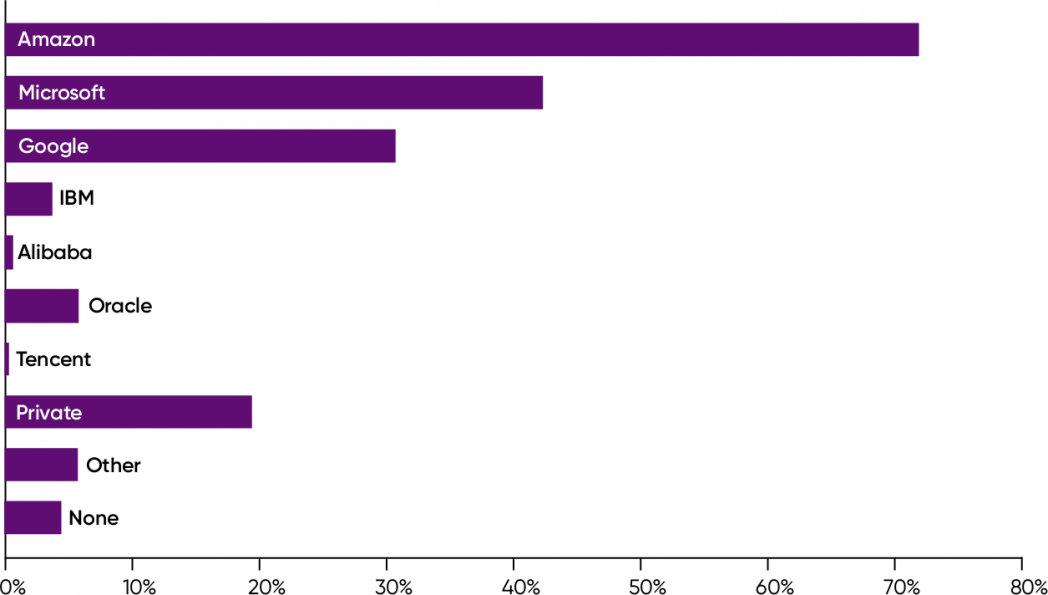
A survey of this type wouldn’t be complete without talking about the major cloud providers. There’s no really big news here (Figure 15). Amazon Web Services has the most users, at 72%, followed by Microsoft Azure (42%) and Google Cloud (31%). Compared to the cloud survey we did last year, it looks like Google Cloud and Azure have dropped slightly compared to AWS. But the changes aren’t large. Oracle’s cloud offering was surprisingly strong at 6%, and 4% of the respondents use IBM Cloud.
When we look at the biggest cloud providers that aren’t based in the US, we find that they’re still a relatively small component of cloud usage: 0.6% of respondents use Alibaba, while 0.3% use Tencent. Because there are so few users among our respondents, the percentages don’t mean much: a few more users, and we might see something completely different. That said, we expected to see more users working with Alibaba; it’s possible that tensions between the United States and China have made it a less attractive option.
20% of the respondents reported using a private cloud. While it’s not entirely clear what the term “private cloud” means—for some, it just means a traditional data center—almost all the private cloud users also reported using one of the major cloud providers. This isn’t surprising; private clouds make the most sense as part of a hybrid or multicloud strategy, where the private cloud holds data that must be kept on premises for security or compliance reasons.
6% of the respondents reported using a cloud provider that we didn’t list. These answers were almost entirely from minor cloud providers, which had only one or two users among the survey participants. And surprisingly, 4% of the respondents reported that they weren’t using any cloud provider.
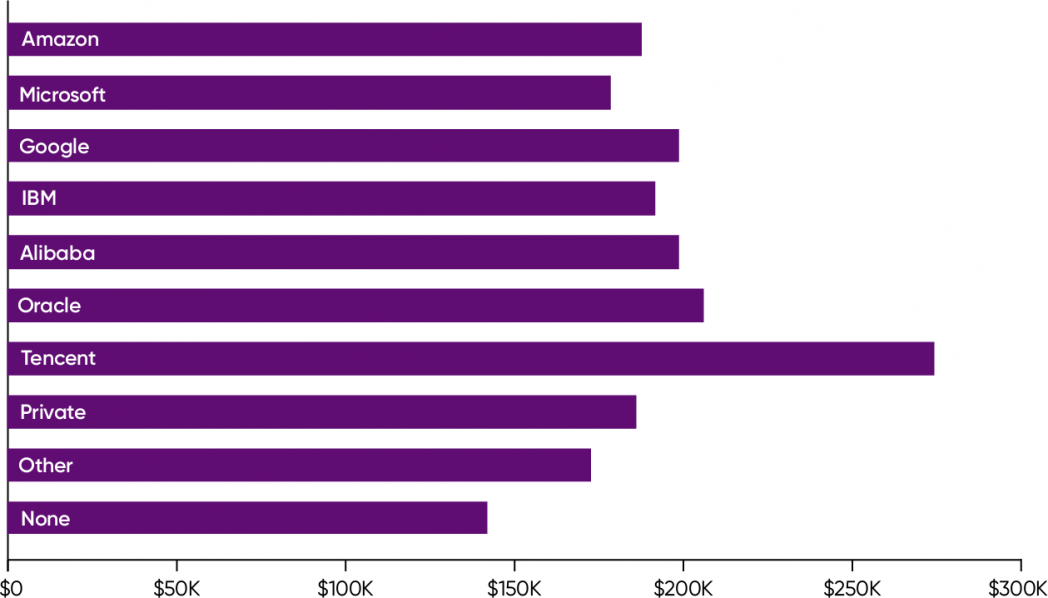
There’s little difference between the salaries reported by people using the major providers (Figure 16). Tencent stands out; the average salary for its users is $275,000. But there were so few Tencent users among the survey respondents that we don’t believe this average is meaningful. There appears to be a slight salary premium for users of Oracle ($206,000) and Google ($199,000); since these cloud providers aren’t as widely used, it’s easy to assume that organizations committed to them are willing to pay slightly more for specialized talent, a phenomenon we’ve observed elsewhere. Almost as a footnote, we see that the respondents who don’t use a cloud have significantly lower salaries ($142,000).
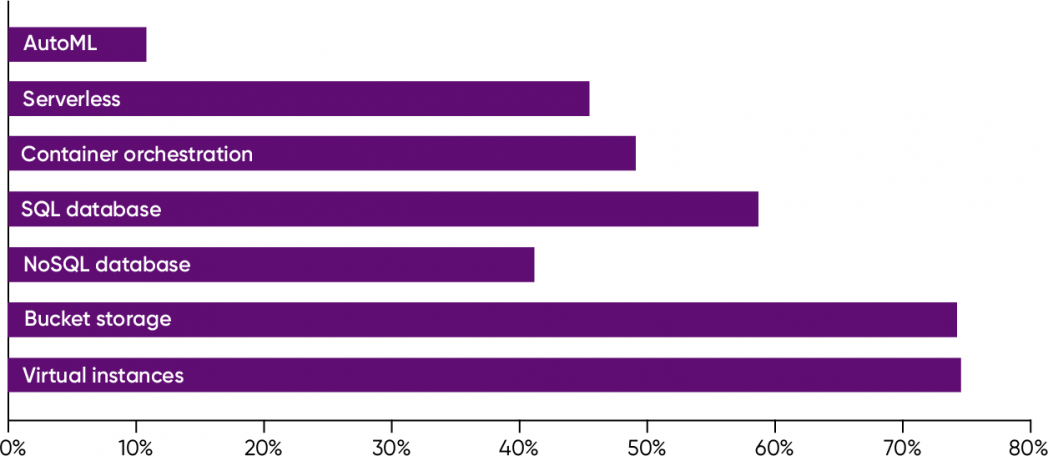
Cloud providers offer many services, but their basic services fall into a few well-defined classes (Figure 17). 75% of the survey respondents reported using virtual instances (for example, AWS EC2), and 74% use bucket storage (for example, AWS S3). These are services that are offered by every cloud provider. Most respondents use an SQL database (59%). Somewhat smaller numbers reported using a NoSQL database (41%), often in conjunction with an SQL database. 49% use container orchestration services; 45% use “serverless,” which suggests that serverless is more popular than we’ve seen in our other recent surveys.
Only 11% reported using some kind of AutoML—again, a service that’s provided by all the major cloud providers, though under differing names. And again, we saw no significant differences in salary based on what services were in use. That makes perfect sense; you wouldn’t pay a carpenter more for using a hammer than for using a saw.
The Work Environment
Salaries aside, what are cloud developers working with? What programming languages and tools are they using?
Languages
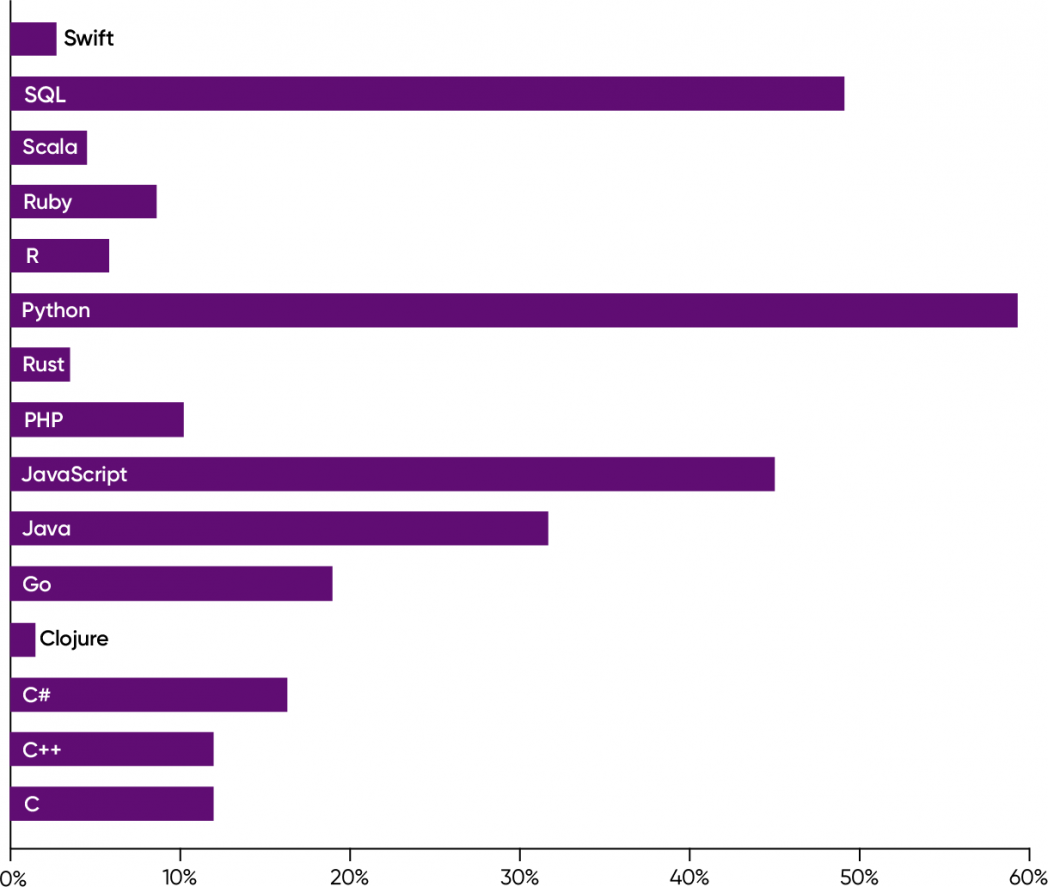
Python is the most widely used language (59% of respondents), followed by SQL (49%), JavaScript (45%), and Java (32%). It’s somewhat surprising that only a third of the respondents use Java, given that programming language surveys done by TIOBE and RedMonk almost always have Java, Python, and JavaScript in a near tie for first place. Java appears not to have adapted well to the cloud (Figure 18).
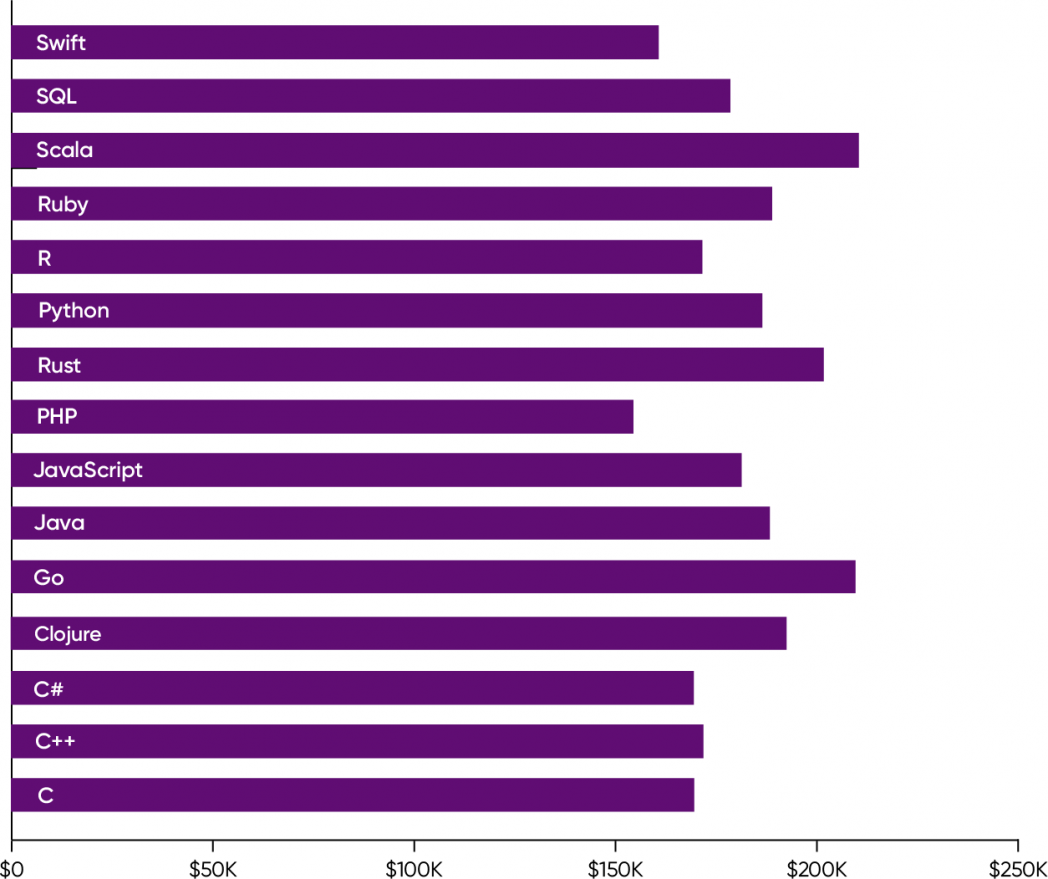
Salaries also follow a pattern that we’ve seen before. Although the top four languages are in high demand, they don’t command particularly high salaries: $187,000 for Python, $179,000 for SQL, $181,000 for JavaScript, and $188,000 for Java (Figure 19). These are all “table stakes” languages: they’re necessary and they’re what most programmers use on the job, but the programmers who use them don’t stand out. And despite the necessity, there’s a lot of talent available to fill these roles. As we saw in last year’s Data/AI Salary Survey report, expertise in Scala, Rust, or Go commands a higher salary ($211,000, $202,000, and $210,000, respectively). While the demand for these languages isn’t as high, there’s a lot less available expertise. Furthermore, fluency in any of these languages shows that a programmer has gone considerably beyond basic competence. They’ve done the work necessary to pick up additional skills.
The lowest salaries were reported by respondents using PHP ($155,000). Salaries for C, C++, and C# are also surprisingly low ($170,000, $172,000, and $170,000, respectively); given the importance of C and C++ for software development in general and the importance of C# for the Microsoft world, we find it hard to understand why.
Almost all of the respondents use multiple languages. If we had to make a recommendation for someone who wanted to move into cloud development or operations, or for someone planning a cloud strategy from scratch, it would be simple: focus on SQL plus one of the other table stakes languages (Java, JavaScript, or Python). If you want to go further, pick one of the languages associated with the highest salaries. We think Scala is past its peak, but because of its strong connection to the Java ecosystem, Scala makes sense for Java programmers. For Pythonistas, we’d recommend choosing Go or Rust.
Operating Systems
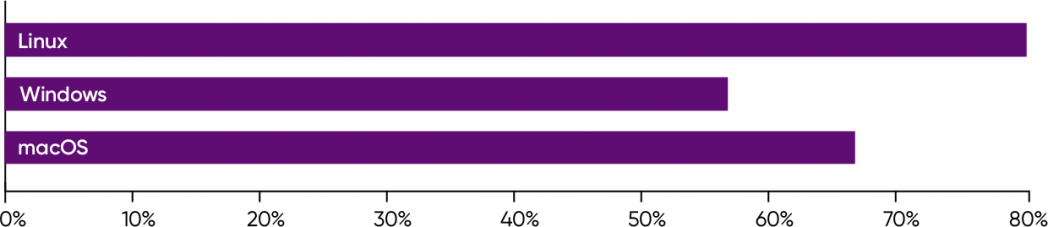
We asked our survey participants which operating systems they used so we could test something we’ve heard from several people who hire software developers: Linux is a must. That appears to be the case: 80% of respondents use Linux (Figure 20). Even though Linux really hasn’t succeeded in the desktop market (sorry), it’s clearly the operating system for most software that runs in the cloud. If Linux isn’t a requirement, it’s awfully close.
67% of the respondents reported using macOS, but we suspect that’s mostly as a desktop or laptop operating system. Of the major providers, only AWS offers macOS virtual instances, and they’re not widely used. (Apple’s license only allows macOS to run on Apple hardware, and only AWS provides Apple servers.) 57% of the respondents reported using some version of Windows. While we suspect that Windows is also used primarily as a desktop or laptop operating system, Windows virtual instances are available from all the major providers, including Oracle and IBM.
Tools
We saw little variation in salary from tool to tool. This lack of variation makes sense. As we said above, we don’t expect a carpenter who uses a hammer to be paid more than a carpenter who uses a saw. To be a competent carpenter, you need to use both, along with levels, squares, and a host of other tools.
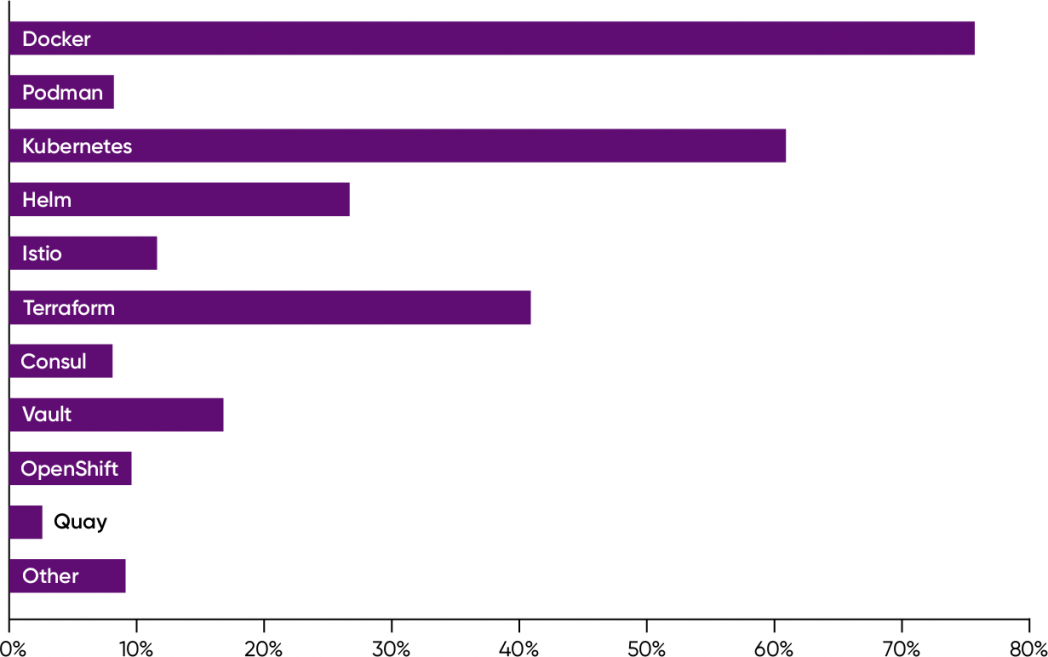
However, it is interesting to know what tools are commonly in use (Figure 21). There aren’t any real surprises. Docker is almost universal, used by 76% of the respondents. Kubernetes use is very widespread, by 61% of the respondents. Other components of the Kubernetes ecosystem didn’t fare as well: 27% of respondents reported using Helm, and 12% reported using Istio, which has been widely criticized for being too complex.
Alternatives to this core cluster of tools don’t appear to have much traction. 10% of the respondents reported using OpenShift, the IBM/Red Hat package that includes Kubernetes and other core components. Our respondents seem to prefer building their tooling environment themselves. Podman, an alternative to Docker and a component of OpenShift, is only used by 8% of the respondents. Unfortunately, we didn’t ask about Linkerd, which appears to be establishing itself as a service mesh that’s simpler to configure than Istio. However, it didn’t show up among the write-in responses, and the number of respondents who said “other” was relatively small (9%).
The HashiCorp tool set (Terraform, Consul, and Vault) appears to be more widely used: 41% of the respondents reported using Terraform, 17% use Vault, and 8% use Consul. However, don’t view these as alternatives to Kubernetes. Terraform is a tool for building and configuring cloud infrastructure, and Vault is a secure repository for secrets. Only Consul competes directly.
The Biggest Impact
Finally, we asked the respondents what would have the biggest impact on compensation and promotion. The least common answer was “data tools” (6%). This segment of our audience clearly isn’t working directly with data science or AI—though we’d argue that might change as more machine learning applications reach production. “Programming languages” was second from the bottom. The lack of concern about programming languages reflects reality. While we observed higher salaries for respondents who used Scala, Rust, or Go, if you’re solidly grounded in the basics (like Python and SQL), you’re in good shape. There’s limited value in pursuing additional languages once you have the table stakes.
The largest number of respondents said that knowledge of “cloud and containers” would have the largest effect on compensation. Again, containers are table stakes, as we saw in the previous section. Automation, security, and machine learning were also highly rated (18%, 15%, and 16%, respectively). It’s not clear why machine learning was ranked highly but data tools wasn’t. Perhaps our respondents interpreted “data tools” as software like Excel, R, and pandas.
11% of the respondents wrote in an answer. As usual with write-ins, the submissions were scattered, and mostly singletons. However, many of the write-in answers pointed toward leadership and management skills. Taken all together, these varied responses add up to about 2% of the total respondents. Not a large number, but still a signal that some part of our audience is thinking seriously about IT leadership.
Confidence in the Future
“Cloud adoption is up and to the right”? No, we already told you we weren’t going to conclude that. Though it’s no doubt true; we don’t see cloud adoption slowing in the near future.
Salaries are high. That’s good for employees and difficult for employers. It’s common for staff to jump to another employer offering a higher salary and a generous signing bonus. The current stock market correction may put a damper on that trend. There are signs that Silicon Valley’s money supply is starting to dry up, in part because of higher interest rates but also because investors are nervous about how the online economy will respond to regulation, and impatient with startups whose business plan is to lose billions “buying” a market before they figure out how to make money. Higher interest rates and nervous investors could mean an end to skyrocketing salaries.
The gap between women’s and men’s salaries has narrowed, but it hasn’t closed. While we don’t have a direct comparison for the previous year, last year’s Data/AI Salary Surveyreport showed a 16% gap. In this survey, the gap has been cut to 7%, and women are receiving salary increases that are likely to close that gap even further. It’s anyone’s guess how this will play out in the future. Talent is in short supply, and that puts upward pressure on salaries. Next year, will we see women’s salaries on par with men’s? Or will the gap widen again when the talent shortage isn’t so acute?
While we aren’t surprised by the trend toward remote work, we are surprised at how widespread remote work has become: as we saw, only 10% of our survey respondents never work remotely, and almost two-thirds work remotely full time. Remote work may be easier for cloud professionals, because part of their job is inherently remote. However, after seeing these results, we’d predict similar numbers for other industry sectors. Remote work is here to stay.
Almost half of our survey respondents participated in some form of training in the past year. Training on the major cloud platforms (AWS, Azure, and Google Cloud) was associated with higher salaries. However, our participants also wrote in 55 “other” kinds of training and certifications, of which the most popular was CKA (Certified Kubernetes Administrator).
Let’s end by thinking a bit more about the most common answer to the question “What area do you feel will have the biggest impact on compensation and promotion in the next year?”: cloud and containers. Our first reaction is that this is a poorly phrased option; we should have just asked about containers. Perhaps that’s true, but there’s something deeper hidden in this answer. If you want to get ahead in cloud computing, learn more about the cloud. It’s tautological, but it also shows some real confidence in where the industry is heading. Cloud professionals may be looking for their next employer, but they aren’t looking to jump ship to the “next big thing.” Businesses aren’t jumping away from the cloud to “the next big thing” either; whether it’s AI, the “metaverse,” or something else, their next big thing will be built in the cloud. And containers are the building blocks of the cloud; they’re the foundation on which the future of cloud computing rests. Salaries are certainly “up and to the right,” and we don’t see demand for cloud-capable talent dropping any time in the near future.