Exploring San Francisco
Having explored the differences between cities, we turned to look at a single city in more detail. San Francisco is the obvious choice: it is the largest city in the data, it is the city with which we are most familiar, and it has some iconic features that should be easy for others to identify, too. We started our exploration by extracting all addresses within San Francisco that were geocoded with a fairly high degree of accuracy, giving us a total of 25,377 addresses. We created a simple scatterplot of the latitudes and longitudes, shown in Figure 18-13.
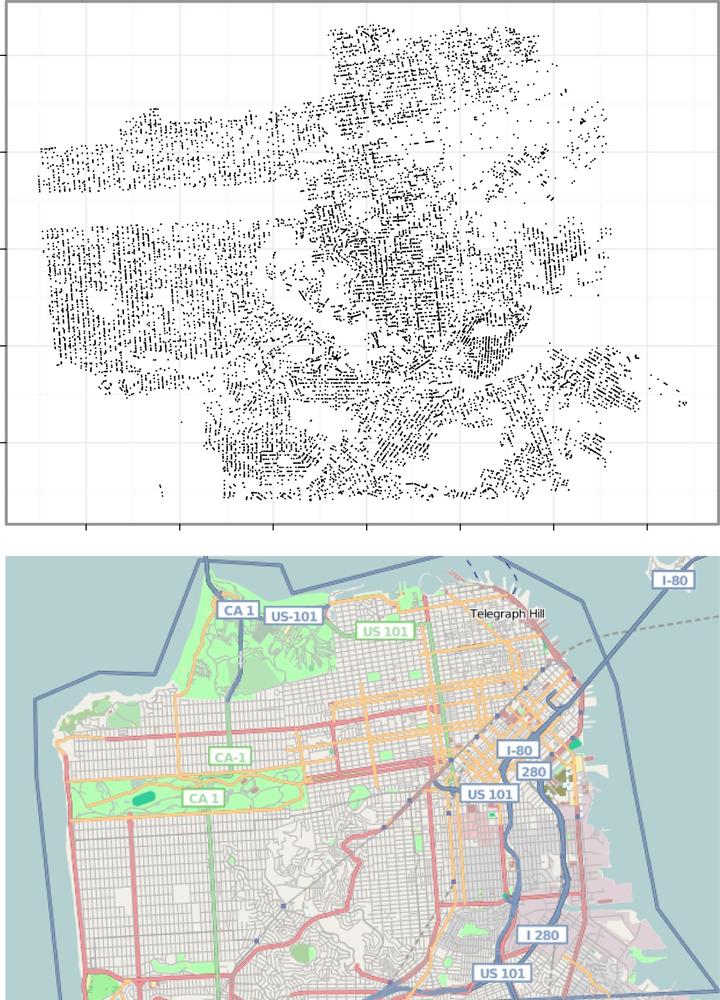
Figure 18-13. (Top) A small point is drawn for every residential sale in the data. It gives us a pretty good feel for the layout of San Francisco. (Bottom) For comparison, a street map of San Francisco from http://openstreetmap.com. (See Color Plate 68.)
For the residential parts of the city, this gives an amazingly detailed picture. We can see the orientation of the streets, the waterfront boundaries, and parks. Our view of some areas, like downtown, is patchier because there are fewer residential homes there. (In this section, we will avoid using the shorthand term "house" since it is obvious that so many of the home sales represent apartments.)
One problem with this plot is we cannot see the number of sales at each specific location. Figure 18-14 shows two attempts to recapture the information. At the top, ...
Get Beautiful Data now with the O’Reilly learning platform.
O’Reilly members experience books, live events, courses curated by job role, and more from O’Reilly and nearly 200 top publishers.

