Chapter 4. Strategies for Controlling Metric Data Growth

Metrics are growing in scale, and that means the data they produce also grows exponentially, far outpacing the growth of the business and its infrastructure (as shown in Figure 4-1). Growth this fast causes problems: storing all of the data your metrics produce about everything (logs, metrics, and traces) would be prohibitively expensive in terms of both cost and performance. In a survey of 357 IT, DevOps, and application development professionals by ESG, 71% saw the growth rate of observability data as “alarming.”1
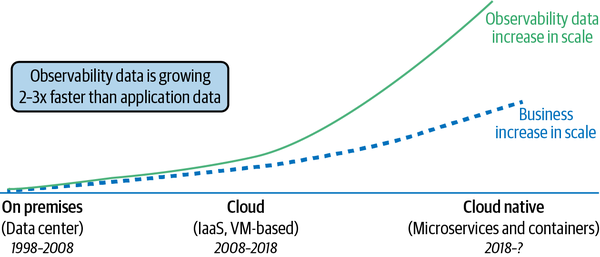
Figure 4-1. Cloud native’s impact on observability data growth2

Why so much growth? The reasons include faster deployments, a shift to microservices architectures, the ephemerality of containers, and even the cardinality of metric data itself. This causes a dilemma: how should you identify which metric data is worth storing?

To answer this question, you need to understand the major use cases for metrics in your organization. Look at RPC traffic, request/response rates, and latency, ideally as they enter your system. If you have, for example, 100 microservices, how many dimensions should you add to your metrics? Should you capture all data as it comes in for each metric?

Metrics cardinalities can generally be classified into three types, as Chronosphere’s John Potocny notes:3

High-value cardinality

These are the dimensions we need to measure to understand our systems, and they are always (or at least often) preserved when consuming metrics in alerts and dashboards.

Low-value or incidental cardinality

The value of these dimensions is more questionable. They may be an unintentional by-product of how you collect metrics instead of dimensions that you purposefully collected.

Useless or harmful cardinality

Collecting useless or harmful dimensions is essentially an antipattern, to be avoided at all costs. Including such dimensions can explode the amount of data you collect, resulting in serious consequences for your metric system’s health and significant problems querying metrics.

To determine which type of cardinality you’re dealing with, look back to the principle we laid out in the beginning of this report: take an outcomes-based approach. Is the data you’re getting useful for remediation? How does it affect your customers’ outcomes? Is it really necessary to capture this data through a metric, or could you capture it through traces or logs instead? If you’re not getting what you need to solve your problems, what’s missing? If you’re getting metric data that you don’t or can’t use, can you identify what isn’t helpful?

Next, we’ll look at the three key strategies of an outcomes-based approach: retention, resolution, and aggregation. They are useful whether your approach is fully managed or self-managed. Note that Thanos and Cortex do not have special resolution and aggregation functionalities like M3 does; they use Prometheus’s default capabilities instead.

Retention

How long are you keeping your data? Prometheus’s default retention period is 15 days. However, most organizations we’ve worked with retain all metric data for 13 months, whether it relates to production, staging, or even development environments! Do you actually need or use 13 months’ worth of metric data?

Let’s say you’re collecting metrics for development environments and retaining them for 13 months. Is that useful if the development environment gets recycled every week? What if you retained those development metrics for a few weeks instead?

Don’t just stick with the default: base your retention periods for different kinds of data on the outcomes that you can gain by retaining it. If you reduce the retention period for data that you do not need, the overall volume will grow at a much more reasonable rate.

In Prometheus, you can configure retention globally by using --storage.tsdb.retention.size and --storage.tsdb.reten⁠tion​.time flags at startup. The self-managed remote storage systems Thanos and Cortex use blob storage as an ultimate backend store, suggesting the possibility of infinite retention. However, M3 has a different approach, which we’ll examine in a moment.

Resolution

How often do you collect metric data? Can you improve your outcomes by collecting data more frequently? The frequency of data collection is called resolution—more data points, just like more pixels in a photograph, would mean a higher resolution.

Let’s say your development environments are deploying multiple times a day. Do you need per-minute metrics for all of them? Perhaps for some applications that would be helpful. But other environments or applications might need only metrics every 10 seconds or every minute. Some might not need metrics at all! Collecting at a lower resolution for certain environments can drastically reduce your metric data’s growth.

Using Prometheus, you can resolve individual scrape jobs using scrape_interval. This example below resolves metrics every minute:

- job_name: nginx_ingress
  scrape_interval: 1m
  scrape_timeout: 10s
  metrics_path: /metrics
  scheme: https

Feel free to make the scrape_interval as granular as possible, since it is tied to individual scrape jobs.

Applying Resolution and Retention in M3

If you are using M3, you can apply both resolution and retention strategies with the mapping rules feature. A helpful doc by M3 examines the following rule:4

downsample:
  rules:
    mappingRules:
      - name: "mysql metrics"
        filter: "app:mysql*"
        aggregations: ["Last"]
        storagePolicies:
          - resolution: 1m
            retention: 48h
      - name: "nginx metrics"
        filter: "app:nginx*"
        aggregations: ["Last"]
        storagePolicies:
          - resolution: 30s
            retention: 24h
          - resolution: 1m
            retention: 48h

In this rule, the authors note, “We have two mapping rules configured—one for mysql metrics and one for nginx metrics. The filter determines what metrics each rule applies to. The mysql metrics rule will apply to any metrics where the app tag contains mysql* as the value (* being a wildcard). Similarly, the nginx metrics rule will apply to all metrics where the app tag contains nginx* as the value.”

M3’s metric data storage policies can define dynamic settings that allow for a mix of retention and resolution, unlike those of Thanos and Cortex, which only has a single resolution and retention setting for all the metrics when scraping metrics, supported by default in Prometheus.

Aggregation

Aggregation is perhaps the most effective of these three strategies. Most applications that generate metrics generate high cardinality and volume by default.

Imagine you have a web application that is running behind NGINX Proxy. NGINX produces very granular HTTP metrics: when you start scraping metrics, by default, it’s all or nothing. Do you really need data for every dimension? If you’re trying to measure the latency of your HTTP responses, will it be useful to know the NGINX version or which data center it’s running on?

Combining the right dimensions and dropping any that aren’t useful is important in controlling the growth of your metric data.

Using the aggregation strategy is about paying attention to what you’re capturing, choosing the metrics and dimensions you really need and combining them, and dropping the rest to keep metrics growth under control. Additionally, the aggregation strategy can be used in conjunction with resolution and retention strategies.

In Prometheus, you can aggregate metrics via recording rules, which periodically compute expensive queries in the background, such as aggregating and dropping a high-cardinality dimension.

While recording rules can help improve performance by computing aggregates, they do not make it possible to drop the original data; doing so requires a federated setup and is quite cumbersome to manage.

To successfully reduce metric data through aggregation in Prometheus, you have to federate Prometheus instances and then combine and drop metrics via recording rules, as in Figure 4-2.

Figure 4-2. Showing a combination of federation and recording rules to aggregate metrics

The reason we aggregate then federate is to work around the limitation of having to store data in Prometheus before we can use recording rules to aggregate it. In this setup, we store, then aggregate, then forward only the aggregated data to another Prometheus instance. This allows us to realize a net reduction in metric data at our final storage location.

Here is an example of a recording rule for aggregation:

groups:
 - name: node
   rules:
    - record: job:process_cpu_seconds:rate5m
      expr: >
        sum without(instance)(
          rate(process_cpu_seconds_total{job="node"}[5m])
        )

This runs the rate(process_cpu_sec⁠onds_total{job="node"}​[5m]) query, dropping the dimension instance, then creates a new metric, job:process_cpu_seconds:rate5m. This new metric has a lower cardinality than the original process_cpu_seconds metric.

Applying Aggregation in M3

Applying aggregation in M3 has a similar effect as in Prometheus. The main difference is that M3 has functionalities called mapping rules and rollup rules, which, when combined, drop unnecessary metrics efficiently by performing aggregation before anything is written and choosing what to keep. This makes aggregating cost-effective. These functionalities also allow M3 to do the same aggregation as Prometheus—without needing to create a federated setup. Consider an example from M3:5

downsample:
  rules:
    mappingRules:
      - name: "http_request latency by route \ 
          and git_sha drop raw"
        filter: "__name__:http_request_bucket k8s_pod:* \ 
          le:* git_sha:* route:*"
        filter: "__name__:http_request_bucket k8s_pod:* \ 
          le:* git_sha:* route:*"
      - name: "http_request latency by route \ 
          and git_sha without pod"
        filter: "__name__:http_request_bucket k8s_pod:* \ 
          le:* git_sha:* route:*"
      - name: "http_request latency by route \ 
          and git_sha without pod"
        filter: "__name__:http_request_bucket k8s_pod:* \ 
          le:* git_sha:* route:*"
            metricName: "http_request_bucket" \ 
              # metric name doesn't change
            groupBy: ["le", "git_sha", "route", \ 
              "status_code", "region"]
        filter: "__name__:http_request_bucket k8s_pod:* \ 
          le:* git_sha:* route:*"
            metricName: "http_request_bucket" \ 
              # metric name doesn't change
            groupBy: ["le", "git_sha", "route", \ 
              "status_code", "region"]
        filter: "__name__:http_request_bucket k8s_pod:* \ 
          le:* git_sha:* route:*"
            metricName: "http_request_bucket" \ 
              # metric name doesn't change
            groupBy: ["le", "git_sha", "route", \ 
              "status_code", "region"]
            type: "Increase"
        - rollup:
            metricName: "http_request_bucket" \ 
              # metric name doesn't change
            groupBy: ["le", "git_sha", "route", \ 
              "status_code", "region"]
            aggregations: ["Sum"]
        - transform:
            type: "Add"
        storagePolicies:
        - resolution: 30s
          retention: 720h

The rollup rule above eliminates the k8s_pod label for the http_request_bucket metric that we’re matching against. To do this, we add up the http_request_bucket metric grouped by the other dimensions it has that we want to keep. In addition, we pair it with a mapping rule that drops the original data, which allows us to retain the original http_request_bucket metric name rather than creating a new metric name for the aggregate.

Conclusion

Explosive data growth does not equate to better observability—there is so much more to it. Finding the right balance between too much information and not enough is key. The metrics you capture and retain should be useful to your business goals and outcomes and should measure crucial business and application benchmarks. These three key strategies—resolution, retention, and aggregation—can help you control the growth of your metric data, so you’re only getting and keeping what counts. Remember, it’s all about outcomes.

1 Rachel Dines, “New ESG Study Uncovers Top Observability Concerns in 2022,” Chronosphere, February 22, 2022, https://chronosphere.io/learn/new-study-uncovers-top-observability-concerns-in-2022.

2 Adapted from an image by Chronosphere.

3 John Potocny, “Classifying Types of Metric Cardinality,” Chronosphere, February 15, 2022, https://chronosphere.io/learn/classifying-types-of-metric-cardinality.

4 “Mapping Rules,” M3, accessed March 16, 2022, https://oreil.ly/xJ5wT.

5 “Rollup Rules,” M3, accessed March 16, 2022, https://oreil.ly/Oz5eT.

Get Cloud Native Monitoring now with the O’Reilly learning platform.

O’Reilly members experience books, live events, courses curated by job role, and more from O’Reilly and nearly 200 top publishers.