Chapter 4. Best Practices for Instrumentation
The first step of any journey is the hardest—including the journey of instrumenting your applications for distributed tracing. Questions pile upon questions: What should I do first? How do I know I’m doing things right? When am I done? Every application is different, but this chapter offers some general advice and strategies to create best practices for instrumenting applications.
Best practices do not exist in a vacuum. The data your instrumentation generates will be collected by a trace analysis system, which will analyze it and process it. As the instrumenter, it’s critical that you provide it with the best data possible!
We’ll first discuss an application that lacks instrumentation in order to ground our discussion. Then, we’ll talk about the first steps for instrumenting an existing application—looking at the nodes and edges—and some common ways to accomplish that. We’ll go over best practices for creating spans and the sort of information you’ll want to add to them. We’ll discuss how you’d use tracing as part of application development to validate that your architecture is working the way you expect it to work. Finally, we’ll give you some signals to let you know when you’ve hit “too much” instrumentation.
Tracing by Example
It’s a truism that the best way to learn is by doing. To help make sense of how you should instrument a microservices application for distributed tracing, it stands to reason that you must first have a microservices application. We’ve built a sample application that we will use to illustrate some techniques and best practices. In this section, we’ll describe how you can run the service on your computer in order to follow along with the examples provided, and demonstrate some basic principles of instrumentation that can be applied more generally to instrument your own services.
Installing the Sample Application
We’ve developed a small microservice application to demonstrate the important concepts required to instrument an application. To run it, you’ll need an up-to-date version of the Go runtime and Node.JS installed on your computer. You’ll also need to download a copy of the source code for the application, which can be found at this GitHub repository—you can check it out using the Git version control software, or download and extract a zip archive of the files. Once you’ve got a local copy of the source files, running the software is fairly straightforward: in a terminal window, execute go run cmd/<binary>/main.go from the microcalc directory to run each service. To run the client application, you’ll need to execute npm install in the web subdirectory, then npm start.
The application itself is a basic calculator with three components. The client is a web application for the browser written in HTML and JavaScript that provides an interface to the backend service. The next major component is an API proxy that receives requests from the client and dispatches them to the appropriate worker service. The final component, the operator workers, are services that receive a list of operands, perform the appropriate mathematical operation on those operands, and return the result.
Adding Basic Distributed Tracing
Before you add tracing, look at the code itself and how it functions. We’ll look at the code in order—first, the web client, then the API service, and finally the workers. Once you have an understanding of what each piece of code does, it becomes easier to understand not only how to instrument the service, but why (see Figure 4-1).
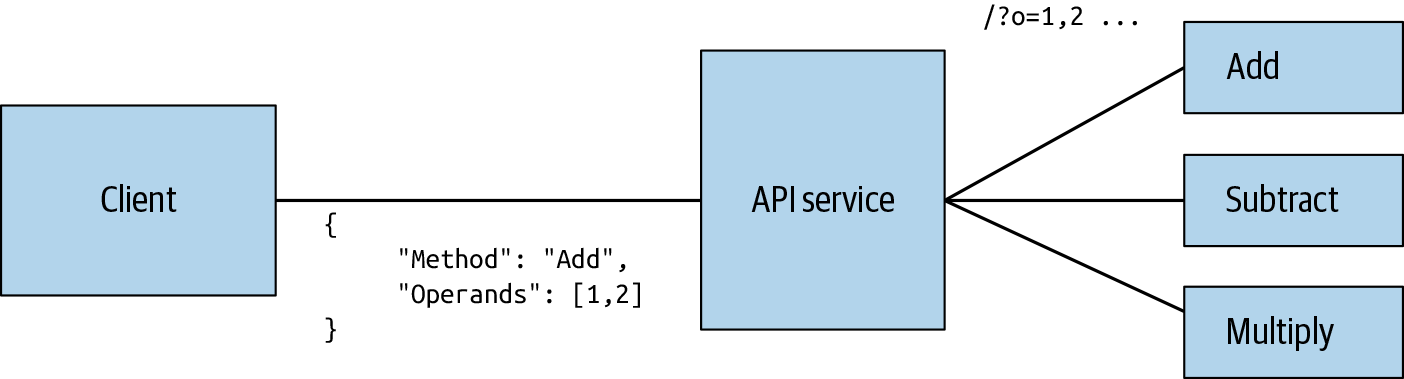
Figure 4-1. The design of MicroCalc.
The client service is very straightforward—a simple HTML and JavaScript frontend. The HTML presents a form, which we intercept in JavaScript and create a XMLHttpRequest that transmits data to the backend services. The uninstrumented version of this code can be seen in Example 4-1. As you can see, we’re not doing anything terribly complicated here—we create a hook on the form element and listen for the onClick event that is emitted when the Submit button is pressed.
Example 4-1. Uninstrumented client service
consthandleForm=()=>{constendpoint='http://localhost:3000/calculate'letform=document.getElementById('calc')constonClick=(event)=>{event.preventDefault();letfd=newFormData(form);letrequestPayload={method:fd.get('calcMethod'),operands:tokenizeOperands(fd.get('values'))};calculate(endpoint,requestPayload).then((res)=>{updateResult(res);});}form.addEventListener('submit',onClick)}constcalculate=(endpoint,payload)=>{returnnewPromise(async(resolve,reject)=>{constreq=newXMLHttpRequest();req.open('POST',endpoint,true);req.setRequestHeader('Content-Type','application/json');req.setRequestHeader('Accept','application/json');req.send(JSON.stringify(payload))req.onload=function(){resolve(req.response);};});};
Your first step when instrumenting this should be to trace the interaction between this service and our backend services. OpenTelemetry helpfully provides an instrumentation plug-in for tracing XMLHttpRequest, so you’ll want to use that for your basic instrumentation. After importing the OpenTelemetry packages, you then need to set up your tracer and plug-ins. Once you’ve accomplished that, wrap your method calls to XMLHttpRequest with some tracing code, as seen in Example 4-2.
Example 4-2. Creating and configuring your tracer
// After importing dependencies, create a tracer and configure itconstwebTracerWithZone=newWebTracer({scopeManager:newZoneScopeManager(),plugins:[newXMLHttpRequestPlugin({ignoreUrls:[/localhost:8090\/sockjs-node/],propagateTraceHeaderCorsUrls:['http://localhost:3000/calculate']})]});webTracerWithZone.addSpanProcessor(newSimpleSpanProcessor(newConsoleSpanExporter()));consthandleForm=()=>{constendpoint='http://localhost:3000/calculate'letform=document.getElementById('calc')constonClick=(event)=>{event.preventDefault();constspan=webTracerWithZone.startSpan('calc-request',{parent:webTracerWithZone.getCurrentSpan()});letfd=newFormData(form);letrequestPayload={method:fd.get('calcMethod'),operands:tokenizeOperands(fd.get('values'))};webTracerWithZone.withSpan(span,()=>{calculate(endpoint,requestPayload).then((res)=>{webTracerWithZone.getCurrentSpan().addEvent('request-complete');span.end();updateResult(res);});});}form.addEventListener('submit',onClick)}

Notice that we’re starting a new span here. This encapsulates our entire logical request from client to server; it is the root span of the trace.

Here we wrap our call to
calculate, which will automatically create a child span. No additional code is required incalculate.
Run the page in web with npm start and click Submit with your browser console open—you should see spans being written to the console output. You’ve now added basic tracing to your client service!
We’ll now look at the backend services—the API and workers. The API provider service uses the Go net/http library to provide an HTTP framework that we’re using as an RPC framework for passing messages between the client, the API service, and the workers. As seen in Figure 4-1, the API receives messages in JSON format from the client, looks up the appropriate worker in its configuration, dispatches the operands to the appropriate worker service, and returns the result to the client.
The API service has two main methods that we care about: Run and calcHandler. The Run method in Example 4-3 initializes the HTTP router and sets up the HTTP server. calcHandler performs the logic of handling incoming requests by parsing the JSON body from the client, matching it to a worker, then creating a well-formed request to the worker service.
Example 4-3. Run method
funcRun(){mux:=http.NewServeMux()mux.Handle("/",http.HandlerFunc(rootHandler))mux.Handle("/calculate",http.HandlerFunc(calcHandler))services=GetServices()log.Println("Initializing server...")err:=http.ListenAndServe(":3000",mux)iferr!=nil{log.Fatalf("Could not initialize server: %s",err)}}
funccalcHandler(whttp.ResponseWriter,req*http.Request){calcRequest,err:=ParseCalcRequest(req.Body)iferr!=nil{http.Error(w,err.Error(),http.StatusBadRequest)return}varurlstringfor_,n:=rangeservices.Services{ifstrings.ToLower(calcRequest.Method)==strings.ToLower(n.Name){j,_:=json.Marshal(calcRequest.Operands)url=fmt.Sprintf("http://%s:%d/%s?o=%s",n.Host,n.Port,strings.ToLower(n.Name),strings.Trim(string(j),"[]"))}}ifurl==""{http.Error(w,"could not find requested calculation method",http.StatusBadRequest)}client:=http.DefaultClientrequest,_:=http.NewRequest("GET",url,nil)res,err:=client.Do(request)iferr!=nil{http.Error(w,err.Error(),http.StatusInternalServerError)return}body,err:=ioutil.ReadAll(res.Body)res.Body.Close()iferr!=nil{http.Error(w,err.Error(),http.StatusInternalServerError)return}resp,err:=strconv.Atoi(string(body))iferr!=nil{http.Error(w,err.Error(),http.StatusInternalServerError)return}fmt.Fprintf(w,"%d",resp)}
Let’s start at the edge of this service and find instrumentation for the RPC framework. In Example 4-4, since we’re using HTTP for communicating between services, you’ll want to instrument the HTTP framework code. Now, you could write this yourself, but it’s generally a better idea to look for open source instrumentation for these common components. In this case, we can utilize the OpenTelemetry project’s existing othttp package to wrap our HTTP routes with tracing instrumentation.
Example 4-4. Using the OpenTelemetry project’s existing othttp package to wrap our HTTP routes with tracing instrumentation
std,err:=stdout.NewExporter(stdout.Options{PrettyPrint:true})traceProvider,err:=sdktrace.NewProvider(sdktrace.WithConfig(sdktrace.Config{DefaultSampler:sdktrace.AlwaysSample()}),sdktrace.WithSyncer(std))mux.Handle("/",othttp.NewHandler(http.HandlerFunc(rootHandler),"root",othttp.WithPublicEndpoint()))mux.Handle("/calculate",othttp.NewHandler(http.HandlerFunc(calcHandler),"calculate",othttp.WithPublicEndpoint()))
Handle errors and such appropriately. Some code has been deleted for clarity.
First, we need to register an exporter to actually view the telemetry output; this could also be an external analysis backend, but we’ll use
stdoutfor now.
Then, register the exporter with the trace provider and set it to sample 100% of spans.
What does this do for us? The instrumentation plug-in will handle quite a bit of “convenience” tasks for us, like propagating spans from incoming requests and adding some useful attributes (seen in Example 4-5) such as the HTTP method type, response code, and more. Simply by adding this, we’re able to begin tracing requests to our backend system. Take special note of the parameter we’ve passed into our instrumentation handler, othttp.WithPublicEndpoint—this will slightly modify how the trace context from the client is flowed to our backend services. Rather than persisting the same TraceID from the client, the incoming context will be associated with a new trace as a link.
Example 4-5. JSON span output
{"SpanContext":{"TraceID":"060a61155cc12b0a83b625aa1808203a","SpanID":"a6ff374ec6ed5c64","TraceFlags":1},"ParentSpanID":"0000000000000000","SpanKind":2,"Name":"go.opentelemetry.io/plugin/othttp/add","StartTime":"2020-01-02T17:34:01.52675-05:00","EndTime":"2020-01-02T17:34:01.526805742-05:00","Attributes":[{"Key":"http.host","Value":{"Type":"STRING","Value":"localhost:3000"}},{"Key":"http.method","Value":{"Type":"STRING","Value":"GET"}},{"Key":"http.path","Value":{"Type":"STRING","Value":"/"}},{"Key":"http.url","Value":{"Type":"STRING","Value":"/"}},{"Key":"http.user_agent","Value":{"Type":"STRING","Value":"HTTPie/1.0.2"}},{"Key":"http.wrote_bytes","Value":{"Type":"INT64","Value":27}},{"Key":"http.status_code","Value":{"Type":"INT64","Value":200}}],"MessageEvents":null,"Links":null,"Status":0,"HasRemoteParent":false,"DroppedAttributeCount":0,"DroppedMessageEventCount":0,"DroppedLinkCount":0,"ChildSpanCount":0}
In calcHandler, we’ll want to do something similar to instrument our outgoing RPC to the worker service. Again, OpenTelemetry contains an instrumentation plug-in for Go’s HTTP client that we can use (see Example 4-6).
Example 4-6. API handler
client:=http.DefaultClient// Get the context from the request in order to pass it to the instrumentation plug-inctx:=req.Context()request,_:=http.NewRequestWithContext(ctx,"GET",url,nil)// Create a new outgoing tracectx,request=httptrace.W3C(ctx,request)// Inject the context into the outgoing requesthttptrace.Inject(ctx,request)// Send the requestres,err:=client.Do(request)
This will add W3C tracing headers to the outgoing request, which can be picked up by the worker, propagating the trace context across the wire. This enables us to visualize the relationship between our services very easily, since spans created in the worker service will have the same trace identifier as the parent(s).
Adding tracing to the worker services is equally straightforward because we’re simply wrapping the router method with the OpenTelemetry trace handler, as shown in Example 4-7.
Example 4-7. Adding the handler
// You also need to add an exporter and register it with the trace provider,// as in the API server, but the code is the samemux.Handle("/",othttp.NewHandler(http.HandlerFunc(addHandler),"add",othttp.WithPublicEndpoint()))
The instrumentation plug-ins handle a great deal of the boilerplate that we need to be concerned with in this and other languages—things like extracting the span context from the incoming request, creating a new child span (or a new root span, if appropriate), and adding that span to the request context. In the next section, we’ll look at how we can extend this basic instrumentation with custom events and attributes from our business logic in order to enhance the utility of our spans and traces.
Custom Instrumentation
At this point, we’ve got the critical parts of tracing set up in our services; each RPC is traced, allowing us to see a single request as it travels from our client service to all of our backend services. In addition, we have a span available in our business logic, carried along the request context, that we can enhance with custom attributes or events. What, then, shall we do? In general, this is really up to you, the instrumenter. We’ll discuss this in more detail in “Effective Tagging”, but it’s helpful to add custom instrumentation for a few things in your business logic—capturing and logging error states, for example, or creating child spans that further describe the functioning of a service. In our API service, we’ve implemented an example of this by passing the local context into a different method (ParseCalcRequest), where we create a new span and enhance it with custom events as shown in Example 4-8.
Example 4-8. Enhancing a span with custom events
varcalcRequestCalcRequesterr=tr.WithSpan(ctx,"generateRequest",func(ctxcontext.Context)error{calcRequest,err=ParseCalcRequest(ctx,b)returnerr})
In Example 4-9, you can see what we’re doing with the passed context—we get the current span from the context and add events to it. In this case, we’ve added some informational events around what the function actually does (parsing the body of our incoming request into an object), and changing the span’s status if the operation failed.
Example 4-9. Adding events to the span
funcParseCalcRequest(ctxcontext.Context,body[]byte)(CalcRequest,error){varparsedRequestCalcRequesttrace.CurrentSpan(ctx).AddEvent(ctx,"attempting to parse body")trace.CurrentSpan(ctx).AddEvent(ctx,fmt.Sprintf("%s",body))err:=json.Unmarshal(body,&parsedRequest)iferr!=nil{trace.CurrentSpan(ctx).SetStatus(codes.InvalidArgument)trace.CurrentSpan(ctx).AddEvent(ctx,err.Error())trace.CurrentSpan(ctx).End()returnparsedRequest,err}trace.CurrentSpan(ctx).End()returnparsedRequest,nil}
Now that you have a basic handle on how to add instrumentation to an application, let’s step back a bit. You might be thinking that “real” applications are obviously more complex and intricate than a purpose-built sample. The good news, however, is that the basic principles we learned and implemented here are generally applicable to instrumenting software of any size or complexity. Let’s take a look at instrumenting software and how to apply these basic principles to microservice applications.
Where to Start—Nodes and Edges
People tend to start at the outside when solving problems—whether they’re organizational, financial, computational, or even culinary. The easiest place to start is at the place that’s closest to you. The same approach applies to instrumenting services for distributed tracing.
Practically, starting from the outside is effective for three major reasons. The first of these is that the edges of your service are the easiest to see—and, thus, manipulate. It’s fairly straightforward to add things that surround a service even if it’s hard to modify the service itself. Second, starting from the outside tends to be organizationally efficient. It can be difficult to convince disparate teams to adopt distributed tracing, especially if the value of that tracing can be hard to see in isolation. Finally, distributed tracing requires context propagation—we need each service to know about the caller’s trace, and each service we call out to needs to know that it’s included in a trace as well. For these reasons, it’s highly useful to begin instrumenting any sort of existing application by starting from the outside and moving in. This can take the form of framework instrumentation or service mesh (or equivalent component) instrumentation.
Framework Instrumentation
In any distributed application, services need to communicate with each other. This RPC traffic can take a variety of protocols and transport methods—structured data over HTTP, Protocol Buffers over gRPC, Apache Thrift, custom protocols over TCP sockets, and more. There must be some equivalency on both sides of this connection. Your services need to be speaking the same language when they talk!
There are two critical components when it comes to instrumentation at the framework level. First, our frameworks must allow us to perform context propagation, the transmission of trace identifiers across the network. Second, our frameworks should aid us in creating spans for each service.
Context propagation is perhaps the easier challenge to solve. Let’s take another look at MicroCalc to discuss it. As shown in Figure 4-2, we’re only using one transport method (HTTP), but two different ways of passing messages—JSON, and query parameters. You can imagine that some of these links could be done differently; for instance, we could refactor the communication between our API service and the worker services to use gRPC, Thrift, or even graphQL. The transport itself is largely irrelevant, the requirement is simply that we are able to pass the trace context to the next service.
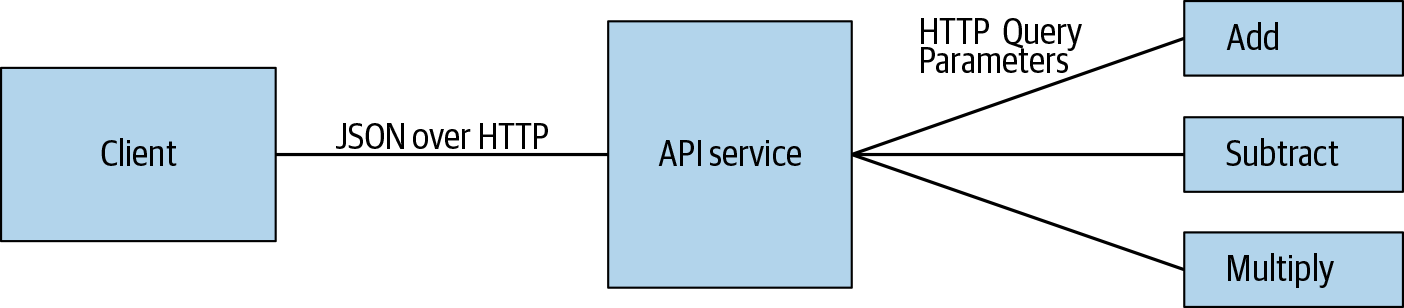
Figure 4-2. The protocols used for inter-service communication in MicroCalc.
Once you identify the transport protocols your services use to communicate, consider the critical path for your service calls. In short, identify the path of calls as a request moves through your services. In this stage of analysis, you’ll want to focus on components that act as a hub for requests. Why? Generally, these components are going to logically encapsulate operations on the backend and provide an API for multiple clients (such as browser-based web clients or native applications on a mobile device). Therefore, instrumenting these components first allows for a shorter timeline to derive value from tracing. In the preceding example, our API proxy service meets these criteria—our client communicates directly through it for all downstream actions.
After identifying the service you’ll instrument, you should consider the transport method used for requests coming into, and exiting, the service. Our API proxy service exclusively communicates via structured data using HTTP, but this is simply an example for the sake of brevity—in the real world, you’ll often find services that can accept multiple transports and also send outgoing requests through multiple transports. You’ll want to be acutely aware of these complications when instrumenting your own applications.
That said, we’ll look at the actual mechanics of instrumenting our service. In framework instrumentation, you’ll want to instrument the transport framework of your service itself. This can often be implemented as some sort of middleware in your request path: code that is run for each incoming request. This is a common pattern for adding logging to your requests, for example. What middlewares would you want to implement for this service? Logically, you’ll need to accomplish the following:
-
Check whether an incoming request includes a trace context, which would indicate that the request is being traced. If so, add this context to the request.
-
Check whether a context exists in the request. If the context exists, create a new span as a child of the flowed context. Otherwise, create a new root span. Add this span to the request.
-
Check whether a span exists in the request. If a span exists, add other pertinent information available in the request context to it such as the route, user identifiers, etc. Otherwise, do nothing and continue.
These three logical actions can be combined into a single piece of middleware through the use of instrumentation libraries such as the ones we discussed in Chapter 3. We can implement a straightforward version of this middleware in Golang using the OpenTracing library, as Example 4-10 shows, or by using instrumentation plug-ins bundled with frameworks like OpenTelemetry, as we demonstrated in “Tracing by Example”.
Example 4-10. Tracing middleware
funcTracingMiddleware(topentracing.Tracer,hhttp.HandlerFunc)http.HandlerFunc{returnhttp.HandlerFunc(func(whttp.ResponseWriter,r*http.Request){spanContext,_:=t.Extract(opentracing.HTTPHeaders,opentracing.HTTPHeadersCarrier(r.Header))span:=t.StartSpan(r.Method,opentracing.ChildOf(spanContext))span.SetTag("route",r.URL.EscapedPath())r=r.WithContext(opentracing.ContextWithSpan(r.Context(),span.Context()))deferspan.Finish()h(w,r)span.SetTag("status",w.ResponseCode)})}
This snippet accomplishes the goals laid out earlier—we first attempt to extract a span context from the request headers. In the preceding sample, we make some assumptions, namely that our span context will be propagated using HTTP headers and not any sort of binary format. OpenTracing, generally, defines these headers to be of the following formats:
ot-span-id-
A 64- or 128-bit unsigned integer
ot-trace-id-
A 64- or 128-bit unsigned integer
ot-sampled-
A Boolean value indicating if the upstream service has sampled out the trace
Please note that these are not the only types of headers that can contain a span context. You can learn more about other popular header formats in “OpenTracing and OpenCensus”.
As we learned in Chapter 2, the span context is critical to propagating a trace throughout our services, which is why we first extract it from the incoming request. After extracting any incoming headers, our middleware then creates a new span, named after the HTTP operation being performed (GET, POST, PUT, etc.), adds a tag indicating the route being requested, then adds the new span to the Go context object. Finally, the middleware continues the request chain. As the request resolves, it adds the response code from the request to the span, which is closed implicitly through our call to defer.
Let’s imagine that we stopped here. If you were to add this middleware to the API proxy service along with a tracer and trace analyzer, what would you see? Well, every single incoming HTTP request would be traced, for one. This would give you the ability to monitor your API endpoints for latency on every incoming request, a valuable first step when monitoring your application. The other win here is that you have now propagated your trace into the context, allowing for further function or RPC calls to add information or create new spans based off of it. Meanwhile, you will still be able to access latency information, per API route, and use that to inform you of performance issues and potential hotspots in your codebase.
There are trade-offs with instrumenting the framework, however. Framework instrumentation heavily relies on the ability to make code changes to your services themselves. If you can’t modify the service code, you can’t really instrument the transport framework. You may find framework instrumentation difficult if your API proxy acts simply as a translation layer—for example, a thin wrapper that translates JSON over HTTP to a proprietary or internal transport—in this case, the general principle would apply, but you may lack the ability to enrich a span with as much data as you would want. Finally, framework instrumentation may be difficult if you do not have components that centralize requests—for example, a client that calls multiple services directly, rather than through some proxy layer. In this case, you could use the client as the centralization point, and add your initial instrumentation there.
Service Mesh Instrumentation
When discussing the trade-offs of framework instrumentation, the first consideration we mentioned was “What if you can’t change the code?” This isn’t an unreasonable or outlandish hypothetical. There are a variety of reasons that the person instrumenting software isn’t able to modify the service they’re attempting to instrument. Most commonly this is a challenge for larger organizations to address, where the people monitoring the application are separated from the people making the application by geography, time zone, and so forth.
How, then, to instrument code that you can’t touch? In short, you instrument the part of the code that you can touch and go from there.
You should first understand what a service mesh is—if you know, feel free to skip ahead a paragraph or so. A service mesh is a configurable infrastructure layer designed to support interprocess communication among services. It performs this, generally, through sidecar proxies, processes that live alongside each service instance and handle all of the interprocess communication for their associated service. In addition to service communications, the service mesh and its sidecars can handle monitoring, security, service discovery, load balancing, encryption, and more. In essence, the service mesh allows for a separation of developer concerns from operations concerns, allowing teams to specialize and focus on writing performant, secure, and reliable software.
Now that we’re on the same page, let’s talk about what service mesh instrumentation looks like. As indicated earlier, one of the critical features of the sidecar proxy is that all interprocess communication flows through the proxy. This allows us to add tracing to the proxy itself. As it happens, this functionality works out of the box in many modern service mesh projects such as Istio, but at a more hypothetical level, the mechanics look remarkably similar to how framework instrumentation works. On incoming requests, pull the span context from the headers, create a new span using this context, and add tags that describe the operation—finishing the span when the request resolves.
The biggest advantage to this style of instrumentation is that you can get a complete picture of your application. Recall our discussion of framework instrumentation—we started at a centralization point, and then continued outward from there. By instrumenting at the service mesh, all of the services which are managed by the service mesh will be part of the trace, giving you much greater insight into your entire application. In addition, service mesh instrumentation is agnostic to the transport layer of each service. As long as the traffic is being passed through the sidecar, it will be traced.
That said, there are trade-offs and drawbacks to service mesh instrumentation. Primarily, service mesh instrumentation acts as a black box form of instrumentation. You have no idea what’s happening inside the code, and you can’t enrich your spans with data outside of the data that’s already there. Realistically, this means you can achieve some useful implicit findings—tagging spans with HTTP response codes, for example, and presuming that any status code that represents a failed request (like HTTP 500) will be an error—but requires specialized parsing or handling to get explicit information into a span. The other flaw with service mesh instrumentation is that it’s difficult for services to enrich the spans coming from the service mesh. Your sidecar will pass tracing headers into your process, yes—but you will still need to extract those headers, create a span context, and so forth. If each service is creating its own child spans, you can very quickly get into a state where your traces have become extremely large and begin to have a real cost for storage or processing.
Ultimately, service mesh instrumentation and framework instrumentation are not an either/or decision. They work best together! Not all of your services, realistically, will need to be instrumented out of the box, or potentially ever. Let’s talk about why.
Creating Your Service Graph
Regardless of which methodology you use to begin instrumenting your application, you should consider the first milestone you’d like to achieve. What do you want to measure? We would argue that tracing is primarily a way to measure the performance and health of individual services in the context of a larger application. To understand that context, however, you need to have some idea of the connections between your services and how requests flow through the system. Thus, a good first milestone would be to build a service graph for your complete application or some significant subset of it, as Figure 4-3 illustrates.
This comparison should demonstrate the necessity of understanding your service graph. Even when services are simple, with few dependencies, understanding your service graph can be a critical component of improving your MTTR (mean time to recovery) for incidents. Since much of this is bound to unrelated factors, such as the amount of time it takes to deploy a new version of a service, reducing the time spent in diagnosis is the best way to reduce overall MTTR. A key benefit of distributed tracing is that it allows you to implicitly map your services and the relationships between them, allowing you to identify errors in other services that contribute to the latency of a particular request. When applications become more complicated and interconnected, understanding these relationships stops being optional and starts becoming fundamental.
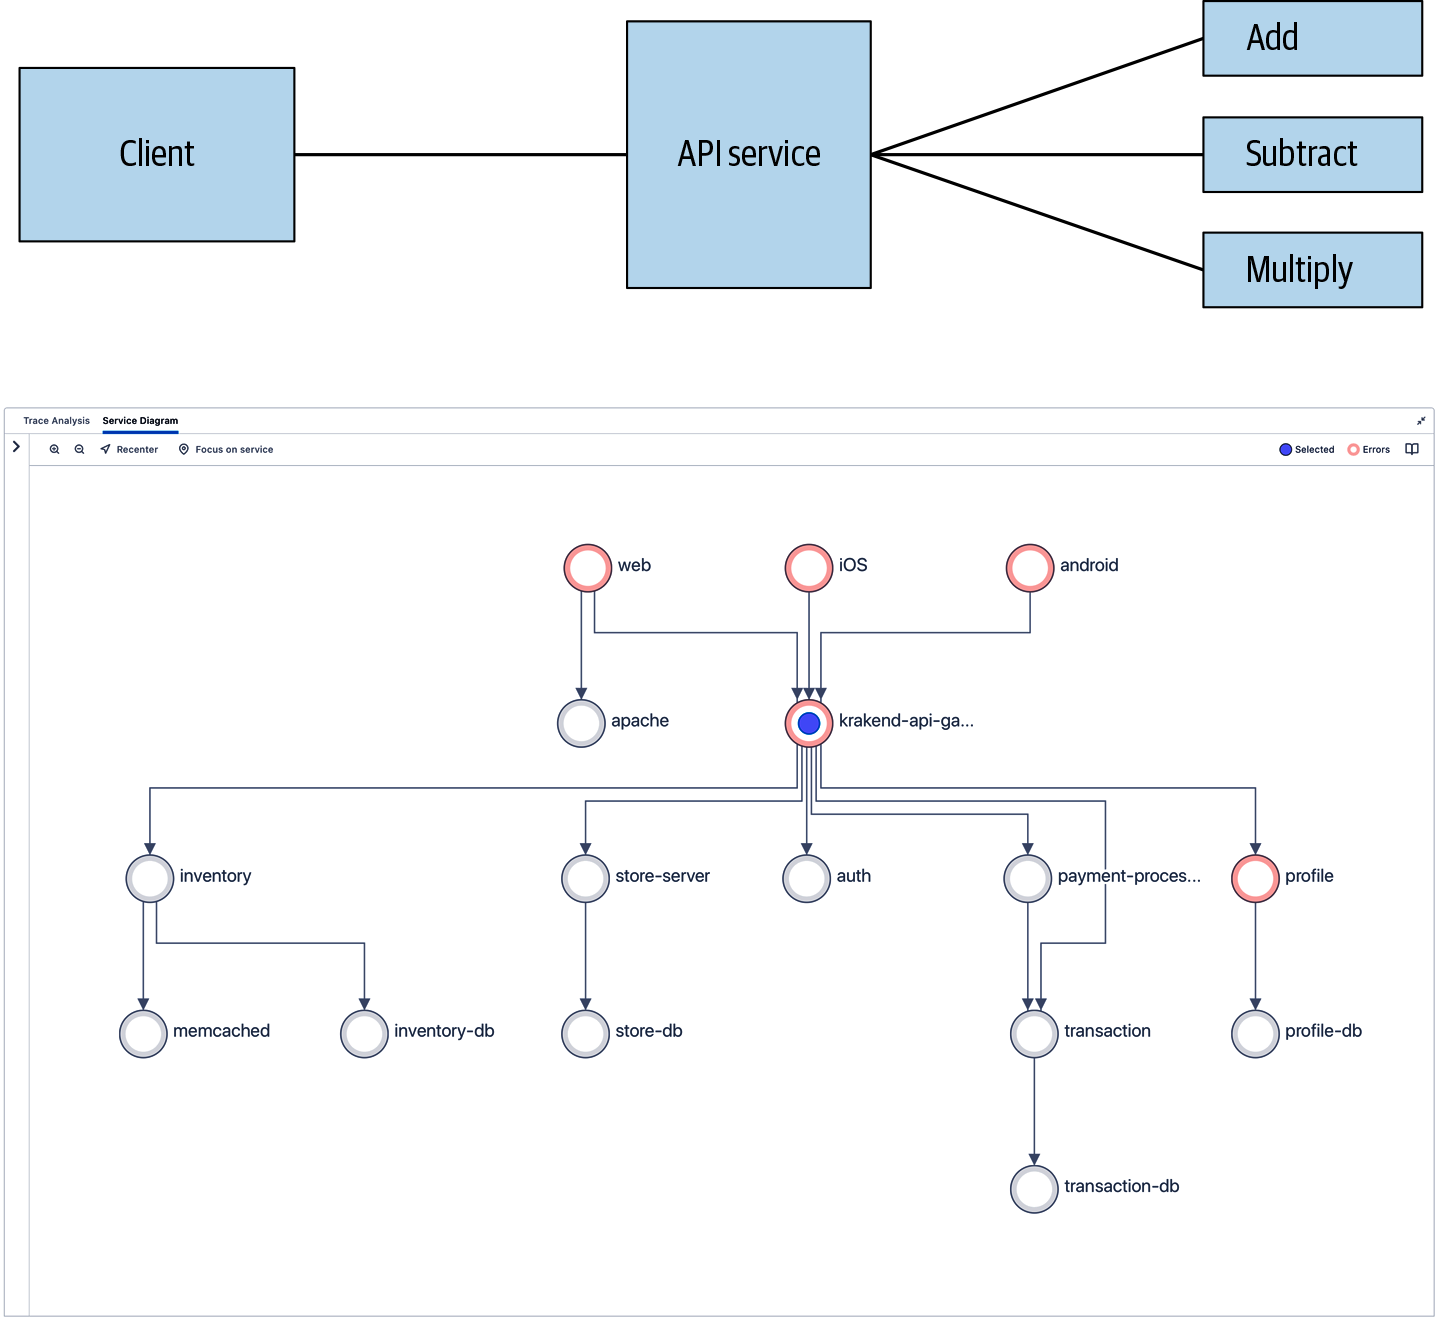
Figure 4-3. A comparison of MicroCalc versus a more complex microservice graph.
In the sample application, you can see that the dependencies between services are fairly straightforward and easy to understand. Even in this simple application, being able to build the entire graph is highly valuable. Let’s imagine that you used a combination of techniques in order to instrument each of our services (API proxy, authentication service, worker services, etc.) and have a trace analyzer that can read and process the spans generated from our application. Using this, you can answer questions that would be difficult if you didn’t have access to these service relationships. These can range from the mundane (“What services contribute most to the latency of this specific operation?”) to the specific (“For this specific customer ID, for this specific transaction, what service is failing?”). However, if you limit yourself to merely tracing the edges of your services, you’re in a bit of a pickle. You can only identify failures very coarsely, such as if a request failed or succeeded.
So, how do you fix this? You have several options. Certainly one is to begin adding instrumentation to the service code itself. As we’ll discuss in the next section, there’s an art and a science to creating spans that are useful for profiling and debugging traced code. The other is to leverage the edges you’ve traced, and mine them for more data. We’ll present three more advanced mechanisms that use the concepts of framework and mesh instrumentation to fill in the gaps of your service mesh.
The first method is to increase the level of detail in our framework-provided spans. In our example HTTP middleware, we recorded only a small amount of detail about the request such as the HTTP method, route, and status code. In reality, each request would potentially have a great deal more data recorded. Are your incoming requests tied to a user? Consider attaching the user identifier to each request as a tag. Service-to-service requests should be identified with some semantic identifiers provided by your tracing library such as OpenTelemetry’s SpanKind attributes or specific tags that allow you to identify the type of a service (cache, database, and so forth). For database calls, instrumenting the database client allows you to capture a wide variety of information such as the actual database instance being used, the database query, and so forth. All of these enrichments help build your service graph into a semantic representation of your application and the connections between it.
The second method is to leverage existing instrumentation and integrations for your services. A variety of plug-ins exist for OpenTelemetry, OpenTracing, and OpenCensus that allow for common open source libraries to emit spans as a part of your existing trace. If you’re facing a daunting instrumentation journey, with a large amount of existing code, you can use these plug-ins to instrument existing frameworks and clients alongside higher-level instrumentation at the service mesh/framework layer. We list a sample of these plug-ins in Appendix A.
The third method is through manual instrumentation, which we covered in “Custom Instrumentation”, and the same principles apply. You’ll want to ensure that a root span is propagated into each service that you can create child spans from. Depending on the level of detail required for a service, you may not need multiple child spans for a single service; consider the pseudocode in Example 4-11.
Example 4-11. A pseudocode method to handle resizing and storing of images
func uploadHandler(request) {
	image = imageHelper.ParseFile(request.Body())
	resizedImage = imageHelper.Resize(image)
	uploadResponse = uploadToBucket(resizedImage)
	return uploadResponse
}
In this case, what do we care about tracing? The answer will vary based on your requirements. There’s an argument for having most of the methods being called here have their own child spans, but the real delineation here would be to restrict child calls to methods that are outside the scope of responsibility for a given team. You can imagine a situation where as our service grows we may factor the functions that parse and resize images out of this into another service. As we’ve written, you’ll probably want to simply encase this whole method in a single span and add tags and logs based off the responses to your method calls, something like Example 4-12.
Example 4-12. Manually instrumenting a method
func uploadHandler(context, request) {
	span = getTracer().startSpanFromContext(context)
	image = imageHelper.ParseFile(request.Body())
	if image == error {
		span.setTag("error", true)
		span.log(image.error)
	}
	// Etc.
}
Any or all of these methods can be intermingled to build a more effective and representative service graph that not only accurately describes the service dependencies of your application but semantically represents the nature of these dependencies. We’ve discussed adding or enriching spans; next, we’ll look at how to create these spans, and how to determine the most important and valuable information you should add to a span.
What’s in a Span?
Spans are the building blocks of distributed tracing, but what does that actually mean? A span represents two things: the span of time that your service was working and the mechanism by which data is carried from your service to some analysis system capable of processing and interpreting it. Creating effective spans that unlock insights into the behavior of your service is one part art, one part science. It involves understanding best practices around assigning names to your spans, ensuring that you’re tagging spans with semantically useful information, and logging structured data.
Effective Naming
What’s in a name? When it comes to a span, this is a very good question! The name of a span, also known as the operation name, is a required value in open source tracing libraries, in fact, it is one of the only required values. Why is this the case? As we’ve alluded to, spans are an abstraction over the work of a service. This is a significant difference from the way you might think of a request chain, or a call stack. You should not have a one-to-one mapping between function name and span name.
That said, what’s in a span name?
First, names should be aggregable. In short, you want to avoid span names that are unique to each execution of a service. One antipattern we see, especially in HTTP services, is implementers making the span name the same as the fully matched route (such as GET /api/v2/users/1532492). This pattern makes it difficult to aggregate operations across thousands or millions of executions, severely reducing the utility of your data. Instead, make the route more generic and move parameters to tags, such as GET /api/v2/users/{id} with an associated tag of userId: 1532492.
Our second piece of advice is that names should describe actions, not resources. To use an example, let’s think back to MicroCalc. We could add a datastore, which could be blob storage, could be SQL, could be anything for any number of purposes, like a user database or a history of previous results. In lieu of naming a span based on the resource it’s accessing, mutating, or otherwise consuming you’ll be far better served by describing the action and tagging the span with the resource type. This allows for queries against your spans across multiple types, allowing for interesting analytical insights. An example would be the difference between the names WriteUserToSQL and WriteUser. You can imagine a situation where these independent components are switched out for testing (suppose we wanted to trial a NoSQL or cloud datastore for our users?); having this less proscriptive name would allow for comparisons between each backing store. Following these two pieces of advice will ensure that your spans are more useful down the line as you analyze them.
Effective Tagging
You’re not required to tag your spans, but you should. Tags are the main way you can enrich a span with more information about what’s happening for a given operation, and unlock a lot of power for analytics. While names will help you aggregate at a high level (so you can ask questions like “What’s my error rate for looking up users across all services?”), tags will allow you to slice and dice that information to better understand the why of your query. Data with a high cardinality should be exposed in your span as a tag, rather than something else—placing high-cardinality data in a name reduces your ability to aggregate operations, and placing it inside of log statements often reduces its indexability.
So, what makes an effective tag? Tags should be externally important, which is to say, they should have meaning to other consumers of your trace data. While there are ways to use tags and traces in development, the tags you emit into a production tracing system should be generally useful to anyone trying to understand what your service is doing.
Tags should be internally consistent as well: using the same keys across multiple services. In our mock application, we could theoretically have each service report the same piece of information (a user ID, let’s say) using different tag keys—userId, UserId, User_ID, USERID, and so forth—but this would be difficult to create queries about in external systems. Consider building helper libraries that standardize these keys, or settle upon a format that comports with your organization’s coding standards.
In addition to the consistency of tag keys, ensure that tag data is kept as consistent as possible within a tag key. If some services report the userId key as a string value, and others as an integer value, problems could arise in your analysis system. Furthermore, ensure that if you’re tracking some numerical value, you add the unit of the tag to the key. For example, if you’re measuring the bytes returned on a request, message_size_kb is more useful than message_size. Tags should be succinct rather than verbose—don’t put stack traces in tags, for example. Remember, tags are critical to querying your trace data and building insights, so don’t neglect them!
Effective Logging
Naming and tagging of spans both assist in your ability to derive insights from your traces. They help you build a relational graph of sorts, showing you what happened (through names) and why it happened (through tags). Logs could be thought of as the how it happened piece of this puzzle, offering developers the ability to attach structured or unstructured text strings to a given span.
Effective logging with spans has two central components. First, ask yourself what you really should be logging. Named and tagged spans can significantly reduce the amount of logging statements required by your code. When in doubt, make a new span rather than a new logging statement. For example, consider the pseudocode in Example 4-13.
Example 4-13. Named and tagged spans
func getAPI(context, request) {
	value = request.Body()
	outgoingRequest = new HttpRequest()
	outgoingRequest.Body = new ValueQuery(value)
	response = await HttpClient().Get(outgoingRequest)
	if response != Http.OK {
		request.error = true
		return
	}
	resValue = response.Body()
	// Go off and do more work
}
Without tracing, you would want to log quite a bit here—for example, the incoming parameters, especially the value you care about inspecting. The outgoing request body would possibly be interesting to log. The response code would definitely be something you’d look to log, especially if it’s an exceptional or error case. With a span, however, there’s significantly less that’s valuable as a log statement—the incoming parameter value, if it’s generally useful, could be a tag such as value:foo, the response code would certainly be one, and so forth. That said, you might still be interested in logging the exact error case that’s happening there. In this situation, consider making a new span for that external request instead. The rationale here is twofold: this is an edge of your application code, and, as discussed earlier, it’s a good practice to trace the edges.
Another reason is that a log statement would be less interesting in terms of data than another span. HTTP GET may seem like a simple operation, and it often is when we think about using it. Consider what’s happening behind the scenes, though—DNS lookups, routing through who-knows-how-many hops, time spent waiting on socket reads, and so forth. This information, if made available in a span through tags, can provide more fine-grained insight into performance issues and is thus better served by being a new span rather than a discrete log operation.
The second aspect to effective logging in your spans is, when possible, write structured logs and be sure your analysis system is capable of understanding them. This is more about ensuring the usability of your spans down the line than anything else—an analysis system can turn structured logging data into something more readable in a GUI, and provides options for performing complex queries (i.e., “show me all logs from Service X where an event was logged with a particular type of exception” or “are any of my services emitting logs at an INFO level?”).
Understanding Performance Considerations
The undesirable side effect of creating these rich, detailed spans is that they all have to go somewhere, and that takes time. Let’s consider a text representation of a typical span for an HTTP request (see Example 4-14).
Example 4-14. Typical span for an HTTP request
{
	context:
	{
		TraceID: 9322f7b2-2435-4f36-acec-f9750e5bd9b7,
		SpanID: b84da0c2-5b5f-4ecf-90d5-0772c0b5cc18
	}
	name: "/api/v1/getCat",
	startTime: 1559595918,
	finishTime: 1559595920,
	endTime:
	tags:
	[
		{
			key: "userId",
			value: 9876546
		},
		{
			key: "srcImagePath",
			value: "s3://cat-objects/19/06/01/catten-arr-djinn.jpg"
		},
		{
			key: "voteTotalPositive",
			value: 9872658
		},
		{
			key: "voteTotalNegative",
			value: 72
		},
		{
			key: "http.status_code",
			value: 200
		},
		{
			key: "env",
			value: "prod"
		},
		{
			key: "cache.hit",
			value: true
		}

	]
}
This is less than 1 KB of data—about 600 bytes. Encoding it in base64 brings that up to around 800 bytes. We’re still under 1 KB, so that’s good—but this is just one span. What would it look like for an error case? A stack trace would probably balloon us up from sub 1 KiB to around 3–4 KiB. Encoding a single span is, again, fractional seconds—(time openssl base64 reports cpu 0.006 total)—which isn’t that much when you get down to it.
Now multiply that by a thousand, ten thousand, a hundred thousand…eventually, it adds up. You’re never going to get any of this for free, but never fear, it’s not as bad as it might seem. The first thing to keep in mind is that you don’t know until you know—there’s no single rule we can give you to magically make everything perform better. The amount of overhead you’re willing to budget for and accept in your application’s performance is going to vary depending on a vast amount of factors that include:
-
Language and runtime
-
Deployment profile
-
Resource utilization
-
Horizontal scalability
With that in mind, you should consider these factors carefully as you begin to instrument your application. Keep in mind that the stable use case and the worst-case performance profile will often look extremely different. More than one developer has found themselves in a hairy situation where some external resource was suddenly unexpectedly available for a long period of time, leading to extremely ungraceful and resource-intensive service crash loops or hangs. A strategy you can use to combat this is to build in safety valves to your internal tracing framework. Depending on your sampling strategy, this “tracing safety valve” could be a cutoff on new span creation if the application is in a persistent failing state, or a gradual reduction in span creation to an asymptotic point.
Additionally, consider building in some sort of method to remotely disable the tracer in your application code. This can be useful in a variety of scenarios beyond the aforementioned unexpected external resource loss; it can also be helpful when wanting to profile your service performance with tracing on versus with tracing off.
Ultimately, the biggest resource cost in tracing isn’t really the service-level cost of creating and sending spans. A single span is most likely a fraction of the data that’s being handled in any given RPC in terms of size. You should experiment with the spans you’re creating, the amount of data you’re adding to them, and the rate at which you’re creating them in order to find the right balance between performance and information that’s required to provide value from tracing.
Trace-Driven Development
When tracing is discussed as part of an application or service, there’s a tendency to “put it off,” so to speak. In fact, there’s almost a hierarchy of monitoring that is applied, in order, to services as they’re developed. You’ll start off with nothing, but quickly start to add log statements to your code, so you can see what’s going on in a particular method or what parameters are being passed around. Quite often, this is the majority of the monitoring that’s applied to a new service up until it’s about ready to be released, at which point you’ll go back in and identify some metrics that you care about (error rate, for example) and stub those in, right before the whole ball of wax gets shoved into your production deployments.
Why is it done this way? For several reasons—some of them good. It can be very difficult to write monitoring code when the code you’re monitoring shifts and churns under your feet—think of how quickly lines of code can be added, removed, or refactored while a project is in development—so it’s something that developers tend not to do, unless there’s a very strong observability practice on their team.
There’s another reason, though, and it’s perhaps the more interesting one. It’s hard to write monitoring code in development because you don’t really know what to monitor. The things you do know to care about, such as an error rate, aren’t really that interesting to monitor and often can be observed through another source, such as through a proxy or API gateway. Machine-level metrics such as memory consumption of your process aren’t something most developers have to worry about, and if they do, those metrics are going to be monitored by a different component rather than by their application itself.
Neither metrics nor logs do a good job of capturing the things you do know about at the beginning of your service’s development, such as what services it should be communicating with, or how it should call functions internally. Tracing offers an option, allowing for the development of traces as you develop your application that both offer necessary context while developing and testing your code and provide a ready-made toolset for observability within your application code. In this section, we’ll cover the two high-level parts of this concept: developing using traces, and testing using traces.
Developing with Traces
No matter what language, platform, or style of service you write, they’ll all probably start at the same place: a whiteboard. It’s this surface that you’ll use to create the model of your service’s functions, and draw lines that represent the connections between it and other services. It makes a lot of sense, especially in the early prototyping phases of development, to start out in such a malleable place.
The problem comes when it’s time to take your model and translate it into code. How do you ensure that what you’ve written on the board matches up with your code? Traditionally the usage of test functions is recommended, but this is perhaps too small of a target to really tell you anything useful. A unit test, by design, should validate the behavior of very small units of functionality—a single method call, for example. You can, of course, write bigger unit tests that begin to validate other suppositions about your functions, such as ensuring that method A calls method B calls method C…but eventually, you’re just writing a test that exercises every code path for spurious reasons.
When you try to test the relationship your service has to antecedent and dependent services, it gets even more convoluted. Generally, these would be considered integration tests. The problem with integration tests to verify your model is twofold, however. The first problem is that if you begin to mock services out, you’re not testing against the actual service, just a mock replacement that follows some preordained command. The second, and perhaps larger, problem is that integration tests are necessarily going to be limited to your test environment and have poor support for communicating across process boundaries (at least, without going through a bunch of hoops to set up an integration test framework or write your own).
If unit tests and integration tests won’t work, then what will? Well, let’s go back to the original point—it’s important to have a way to validate your mental model of your application. That means you should be able to write your code in a way that allows you to ensure both internal methods and external services are being called in the correct order, with the correct parameters, and that errors are handled sanely. One common mistake we’ve observed, especially in code with significant external service dependencies, is what happens on persistent service failure.
You can see examples of this happening in the real world all the time. Consider the outages that occurred as a result of AWS S3 buckets becoming persistently unavailable for hours upon end several years ago. Having trace data available to you, both in test and production, allows you to write tools that quickly compare the desired state of your system with reality. It’s also invaluable when trying to build chaos systems as part of your continuous integration/continuous delivery (CI/CD)—being able to find the differences between your steady-state system and the system under chaos will dramatically improve your ability to build more resilient systems.
Tracing as a part of your development process works similarly to tracing anywhere else in your codebase, with a few notable conveniences. First, recall our earlier discussion of how to start tracing a service (“Where to Start—Nodes and Edges”). The same principle applies to writing a new service and to instrumenting an existing one. You should apply middleware to each incoming request that checks for span data, and if it exists, create a new child span. When your new service emits outbound requests, it too should inject your current span context into the outgoing request so that downstream services that are tracing-aware can take part in the trace. The changes to the process tend to come between these points because you’ll be faced with challenges around how much to trace.
As we’ll discuss at the end of this chapter, there is such a thing as too much tracing. In production especially, you want to limit your traces to the data that matters for external observers and users when they view an end-to-end trace. How, then, to accurately model a single service with multiple internal calls? You’ll want to create some sort of verbosity concept for your tracer. This is extremely common in logging, where log levels exist such as info, debug, warning, and error. Each verbosity specifies at minimum that the log statement must meet to be printed. The same concept can apply to traces as well. Example 4-15 demonstrates one method in Golang to create verbose traces, configurable via an environment variable.
Example 4-15. Creating verbose traces
vartraceVerbose=os.Getenv("TRACE_LEVEL")=="verbose"...funcwithLocalSpan(ctxcontext.Context)(context.Context,opentracing.Span){iftraceVerbose{pc,_,_,ok:=runtime.Caller(1)callerFn:=runtime.FuncForPC(pc)ifok&&callerFn!=nil{span,ctx:=opentracing.StartSpanFromContext(ctx,callerFn.Name())returnctx,span}}returnctx,opentracing.SpanFromContext(ctx)}funcfinishLocalSpan(spanopentracing.Span){iftraceVerbose{span.Finish()}}
Setting trace verbosity isn’t just limited to Go—aspects, attributes, or other dynamic/metaprogramming techniques can be utilized in languages with support for them. The basic idea is as presented, though. First, ensure that the verbosity level is set appropriately. Then, determine the calling function and start a new span as a child of the current one. Finally, return the span and the language context object as appropriate. Note that in this case, we’re only providing a start/finish method—this means that any logs or tags we introduce will not necessarily be added to the verbose child, but could be added to the parent if the child doesn’t exist. If this isn’t desirable, then consider creating helper functions to log or tag through to avoid this behavior. Using our verbose traces is fairly straightforward as well (see Example 4-16).
Example 4-16. Using verbose traces
import("github.com/opentracing-contrib/go-stdlib/nethttp""github.com/opentracing/opentracing-go")funcmain(){// Create and register tracermux:=http.NewServeMux()fs:=http.FileServer(http.Dir("../static"))mux.HandleFunc("/getFoo",getFooHandler)mux.Handle("/",fs)mw:=nethttp.Middleware(tracer,mux)log.Printf("Server listening on port %s",serverPort)http.ListenAndServe(serverPort,mw)}funcgetFooHandler(whttp.ResponseWriter,r*http.Request){foo:=getFoo(r.Context())// Handle response}funcgetFoo(ctxcontext.Context){ctx,localSpan:=withLocalSpan(ctx)// Do stufffinishLocalSpan(localSpan)}
In this example, we’re creating a simple HTTP server in Golang and tracing it with the go-stdlib package. This will parse incoming HTTP requests for tracing headers and create spans appropriately, so the edges of our service are being handled. By adding the withLocalSpan and finishLocalSpan methods, we can create a span that’s local to a function and only exists when our trace verbosity is set appropriately.
These spans could be viewed in a trace analyzer while performing local development, allowing you to accurately assess that calls are happening in the same way that you think they should be, ensuring that you can observe your service as it calls other services (or is called by them), and as a bonus allows you to use open source frameworks as a default choice for questions like, “What logging/metrics/tracing API should I be using?” as these can be performed through your telemetry API. Don’t reinvent the wheel if you don’t need to, after all!
Testing with Traces
Trace data can be represented as a directional acyclic graph. While it’s usually represented as a flame graph, traces are simply directional acyclic graphs of a request, as illustrated in Figure 4-4. A directed acyclic graph, or DAG, may be extremely familiar to you if you have a computer science or mathematics background; it has several properties that are extremely useful. DAGs are finite (they have an end) and they have no directed cycles (they don’t loop on themselves—those that do are called cyclical references). One other useful property of DAGs is that they are fairly easy to compare to each other.
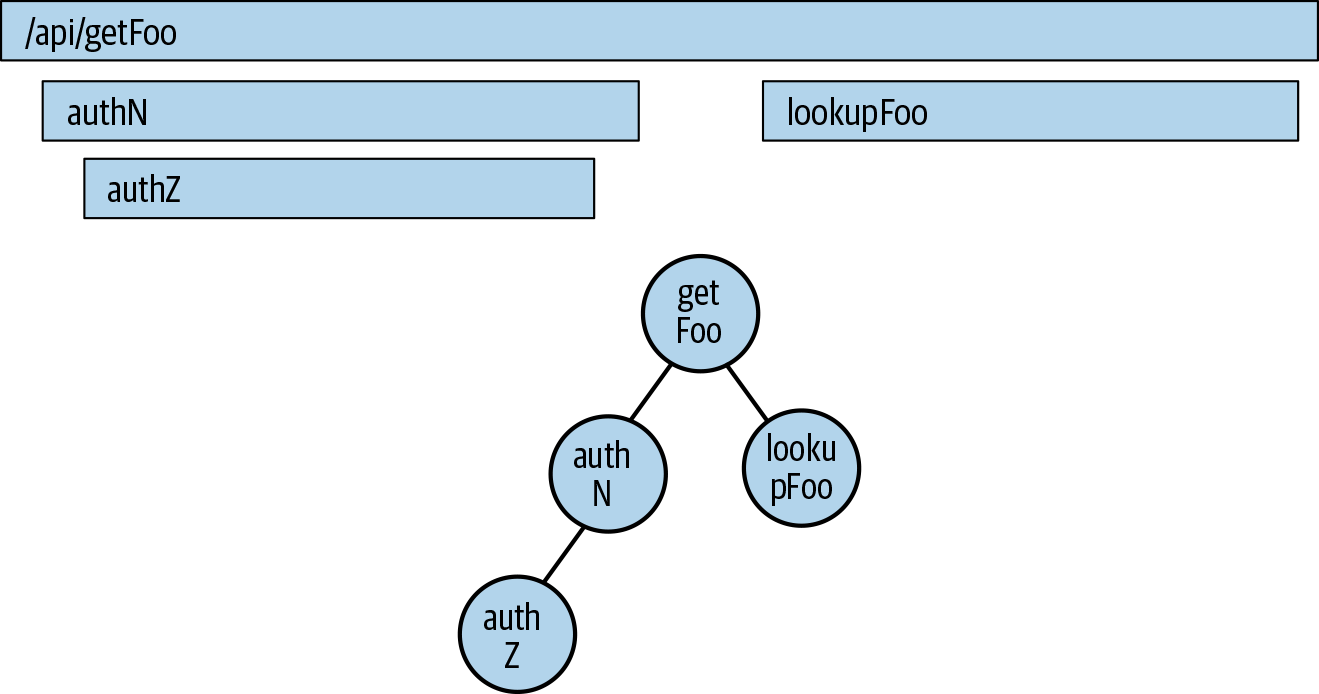
Figure 4-4. Comparison of a flame graph view of a trace versus a DAG view.
Knowing this, what are the possibilities? First, you may be asking, “So what?” As discussed earlier, integration testing and other forms of higher-level tests are sufficient and necessary to ensure the operation of our service as it is deployed. That said, there are several reasons you might want to consider adding trace comparisons to your testing repertoire. The easiest way to think about applied trace data as a form of testing is through simple diffs between environments. Consider a scenario where we deploy a version of our application to a staging or preproduction environment after testing it locally. Further consider that we export our trace data in some sort of flat file, suitable for processing, as shown in Example 4-17.
Example 4-17. Exporting trace data
[
	{
		name: "getFoo",
		spanContext: {
			SpanID: 1,
			TraceID: 1
		},
		parent: nil
	},
	{
		name: "computeFoo",
		spanContext: {
			SpanID: 2,
			TraceID: 1
		},
		parent: spanContext{
			SpanID: 1,
			TraceID: 1
		}
	},
	...
]
In a real system, we might expect these to be out of order or otherwise not exist in a sorted state, but we should expect that the call graph for a single API endpoint will be the same between them.
One potential application, then, is to perform a topographical sort on each set of trace data, then compare by length or through some other diffing process. If our traces differ, we know we have some sort of problem because the results didn’t match our expectations.
Another application of this would be to identify, proactively, when services begin to take dependencies on your service. Consider a situation where our authentication service, or search service, was more widely publicized to other teams. Unbeknownst to us, they start to take a dependency on it in their new services. Automated trace diffing would give us proactive insights into these new consumers, especially if there’s some sort of centralized framework generating and comparing these traces over time.
Still another application is simply using tracing as the backbone of gathering service level indicators and objectives for your service, and automatically comparing them as you deploy new versions. Since traces are inherently able to understand the timing of your service, they’re a great way to keep track of performance changes across a wide variety of requests as you iterate and further develop services.
Ultimately, a lot of this is speculative—we’re not aware of anyone using distributed tracing heavily as a part of their test suites. That doesn’t mean it isn’t useful, but as a new technology, not every facet of it has been explored and exploited yet. Maybe you’ll be the first!
Creating an Instrumentation Plan
For better or worse, most people come to distributed tracing and monitoring late in the development of an application or piece of software. Some of this has to do with the nature of iterative development—when you’re creating a product or service, it can be difficult to understand what it is you need to know until you’ve spent some time actually building and running it. Distributed tracing adds a wrinkle to this as well because developers will often come to it as a solution to problems that are cropping up due to scale and growth, be it in terms of service count or organizational complexity. In both of these cases, you’ll often have some large, presumably complicated set of services already deployed and running and need to know how you can leverage distributed tracing in order to improve the reliability and health of not only your software, but also your team. Perhaps you’re starting greenfield development on some new piece of software and are adding distributed tracing out of the gate—you’ll still need to create a plan for how to both add and grow tracing throughout your team and organization. In this section, we’ll discuss how you can make an effective case for instrumentation of either new or existing services in your organization and how to get buy-in from your (and other) teams, signals that indicate when you’ve instrumented enough, and finally how to sustainably grow instrumentation throughout your services.
Making the Case for Instrumentation
Let’s assume that you’re already sold on the idea of distributed tracing by virtue of you reading this book. The challenge, then, becomes convincing your colleagues that it’s as good of an idea as you think it is, because they’re going to have to do some work as well to ensure that their services are compatible with tracing.
When making the case to other teams about the benefits, and costs, of distributed tracing, it’s important to keep in mind many of the instrumentation lessons that we’ve discussed in this chapter. In short, instrumentation can be valuable even if it’s fairly basic. If every service emits one span with some basic attributes that require no runtime overhead (i.e., string values that can be precalculated at service initialization) then the total added overhead to each request is simply the propagation of trace context headers, a task that adds 25 bytes on the wire and a negligible amount of cycles to decode afterwards.
The benefit—end-to-end tracing of a request—is extremely helpful for such a small price. This request-centric style of distributed tracing has found adopters at companies such as Google, which has used Dapper to diagnose anomalies and steady-state performance problems in addition to attribution for resource utilization.1 Numerous other engineering teams and organizations, large and small, have adopted distributed tracing in order to reduce MTTR for incidents and other production downtime. In addition, distributed tracing is extremely valuable as part of a larger monitoring and observability practice, where it enables you to reduce the search space of data that you need to investigate in order to diagnose incidents, profile performance, and restore your services to a healthy state.
It can be useful to think of distributed tracing as a “level playing field” when it comes to service performance. Especially when interacting in a polyglot environment, or in a globally distributed enterprise, there can be challenges in ensuring that everyone is on the same page in terms of performance data. Some of these challenges are technical, but many are political. The proliferation of vanity metrics is particularly notable here; you can measure quite a few things about your software performance that don’t matter, and you may already be doing so in order to achieve nebulous “quality” goals set for reasons beyond our ken. Distributed tracing data, however, provides critical signals by default in a standardized way for all of your services and does so without requiring synthetic endpoints or approaches to ensuring service health. This trace data can then be used to bring some peace and sanity to a possibly broken process. Of course, the first step to delivering that trace data is service instrumentation, so you’ll need to start there.
It doesn’t have to be difficult to instrument your services. Good tools—open source and proprietary—will ease the instrumentation burden. We detail these in Appendix A, with examples of automatic instrumentation as well as library integrations for popular frameworks that enable tracing—sometimes with no code changes required. You should be aware of your frameworks and shared code when making the case for instrumentation so that you can leverage these existing tools. In our experience, one of the most persuasive arguments for distributed tracing is to simply instrument some existing microservice framework already used by your organization and demonstrate how services using it can be traced by simply updating a dependency. If you have an internal hackathon or hack day, this can be a fun and interesting project to tackle!
No matter how you do it, the case for instrumentation ultimately comes down to the case for distributed tracing in general. As we’ve mentioned, there are plenty of interesting applications for tracing outside performance monitoring: tracing as part of your development cycle, tracing in testing other applications. You could use distributed tracing as part of your CI and CD framework, timing how long certain parts of your build and deployments take. Tracing could be integrated into task runners for creating virtual machines or provisioning containers, allowing you to understand what parts of your build and deploy life cycle take the most time. Tracing can be used as a value-add for services that provide some sort of API as a service—if you’re already tracing the execution time of your backend, you could make some version of that trace data available to your customers in order to help them profile their software as well. The possibilities for tracing are limitless, and the case for instrumenting your software should reflect that.
Instrumentation Quality Checklist
When instrumenting an existing service or creating guidelines on how to instrument new services, it can be useful to have a checklist of items that are important to ensuring quality instrumentation throughout your entire application. We’ve included a recommended one in the book’s repository, but you’re welcome to use it as a jumping-off point for your own.
Much of what’s in our instrumentation checklist is drawn from other parts of this chapter, so we won’t elaborate too much on it. A few notes to call out:
-
Many open source instrumentation libraries or framework instrumentation libraries will, by default, instrument every incoming request or endpoint defined in your service code, including diagnostic endpoints. Generally, you’ll want to implement a filter or sampler on your service to prevent spans being created from these endpoints unless you have some pressing need for it.
-
Be very careful about exposing PII in your attributes and events; the costs for noncompliance can be severe, especially if you’re transmitting trace data to a third party for analysis and storage.
-
Version attributes are extremely valuable, especially when doing trace comparisons, as they allow you to easily diff a request across two or more versions of a service in order to discover performance regressions or improvements.
-
Integrating your feature flags and other experiments with your trace data is a useful way to understand how those experiments are changing the performance and reliability of your service.
Feel free to adapt this checklist with specific information that makes it useful for your team, and include it on service rollout checklists.
Knowing When to Stop Instrumenting
We’ve touched on the costs of instrumentation several times in this chapter; let’s take a deeper look. At a high level, instrumentation is a trade-off like anything else in software. You’re trading some measure of performance for, hopefully, a much higher level of insight into the operation of your service at a level that’s easy to communicate to others in your team or organization. In this section we point out a few notable anti-patterns to watch out for when you’re instrumenting. There’s the risk that the trade-offs become too costly and lead you to stop instrumenting, or to oversample and lose resolution on your traces.
One antipattern is implementing too high a default resolution. A good rule is that your service should emit as many spans as logical operations it performs. Does your service handle authentication and authorization for users? Logically, break down this function—it’s handling an incoming request, performing some lookups in a datastore, transforming the result, and returning it. There are two logical operations here—handling the request/response and looking up the data. It’s always valuable to separate out calls to external services; in this example, you might only have a single span if the datastore is some sort of local database), but you may not need to emit a span for marshaling the response into a new format that your caller expects.
If your service is more complicated, adding more spans can be OK, but you need to consider how consumers of your trace data will find it valuable, and if it’s collapsible into fewer spans. The corollary to this point is that you may want to have the ability to increase the verbosity of spans emitted by a service—refer back to “Trace-Driven Development” for ideas on how to increase or decrease the resolution of your spans. This is why we say default resolution; you want to ensure that the default amount of information emitted is small enough to integrate well into a larger trace, but large enough to ensure that it contains useful information for consumers that might not be on your team (but might be affected by issues with your service!).
Another antipattern is not standardizing your propagation format. This can be challenging, especially when integrating legacy services or services written by a variety of teams. The key value of a trace is in the interconnected nature of a trace. If you have 20, 50, 200, or more services that are using a mishmash of tracing formats, you’re going to have a bad time trying to get value out of your traces. Avoid this by standardizing your tracing practices as much as possible, and providing shims for legacy systems or between different formats.
One method to combat non-standard propagation formats is to create a stack of tracing propagators that can be aware of different headers (such as X-B3 or opentracing) and select the appropriate one on a per-request basis. You might find that it’s less work to actually update existing systems to the new format rather than create compatibility layers—use your best judgment and your organization’s existing standards and practices to figure out what’s right for you.
The final advice, going back to the section title, is knowing when you should stop. Unfortunately, there’s not a cut-and-dry answer here, but there are some signals you should pay attention to. In general, you should consider what your service’s breaking point is without sampling any of your trace data.
Sampling is a practice where a certain percentage of your traces aren’t recorded for analysis in order to reduce the overall load on your system. A discussion of sampling appears in “Sampling”, but we would advise that you don’t consider the sample rate when writing instrumentation. If you’re worried about the amount of spans created by your service, consider using verbosity flags to dynamically adjust how many spans are being created, or consider “tail-based” sampling approaches that analyze the entire trace before making a sampling decision. This is important because sampling is the best way to accidentally throw away potentially critical data that might be useful when debugging or diagnosing an issue in production. In contrast, a traditional sampling approach will make the decision at the beginning of a trace, so there’s no reason to optimize around “will this or won’t this be sampled”—your trace is going to be thrown away in its entirety if it is sampled out.
A sign that you need to keep going is if the inter-service resolution of your trace is too low. For example, if you’re eliding multiple dependent services in a single span, you should keep instrumenting until those services are independent spans. You don’t necessarily need to instrument the dependent services, but your RPC calls to each of them should be instrumented, especially if each of those calls are terminal in your request chain. To be more specific, imagine a worker service that communicates with several datastore wrappers—it may not be necessary to instrument those datastore wrappers, but you should have separate spans for each of the calls from your service to them in order to better understand latency and errors (am I failing to read, or failing to write?).
Stop tracing if the number of spans you’re emitting by default begins to look like the actual call stack of a service. Keep instrumenting if you’ve got unhandled error cases in your service code—being able to categorize spans with errors versus spans without errors is vital. Finally, you should keep instrumenting if you’re finding new things to instrument. Consider modifying your standard bug-handling process to not only include writing new tests to cover the fix, but to include writing new instrumentation to make sure that you can catch it in the future.
Smart and Sustainable Instrumentation Growth
It’s one thing to instrument a single service, or a demonstration application that’s meant to teach you some concepts about tracing. It’s another, altogether more challenging task to figure out where to go from there. Depending on how you start your instrumentation journey, you may quickly find yourself in untested waters, struggling to figure out how to provide value from tracing while simultaneously growing its adoption within your organization or team.
There are several strategies you can employ to grow instrumentation inside your application. These strategies, broadly, can be grouped into technical and organizational solutions. We’ll first address the technical strategies, then talk about the organizational ones. There is some overlap between the two—as you might expect, technical and organizational solutions work hand in hand to enable each other.
Technically, the best way to grow instrumentation throughout your application is to make it easy to use. Providing libraries that do the heavy lifting required to set up tracing and integrate it into your RPC frameworks or other shared code makes it easy for services to integrate tracing. Similarly, creating standard tags, attributes, and other metadata for your organization is a great way to ensure that new teams and services adopting tracing have a road map to quickly understand and gain value from tracing as they enable it. Finally, look at adopting tracing as part of your development and testing process—if teams are able to start using tracing on a day-to-day basis, then it becomes part of their workflow, and it’ll be available once they deploy their services to production.
Ultimately, the goal of instrumentation growth should be tied to the ease of adopting instrumentation. You’re going to find it challenging to grow the adoption of tracing if it’s a lot of work for individual developers to implement. Every major engineering organization to adopt distributed tracing (including Google and Uber) has made tracing a first-class component of its microservice architecture by wrapping its infrastructure libraries in tracing code. This strategy allows for growing instrumentation quite naturally—as new services are deployed or migrated, they’ll automatically gain instrumentation.
Organizationally, there’s a bit more to talk about. All of the technical solutions presented earlier aren’t going to be worth much without organizational buy-in. How, then, should you develop that buy-in? The easiest option, and one we’ve seen be incredibly successful, is simply a top-down mandate to use distributed tracing. Now, this doesn’t necessarily mean you should start emailing your VP of Engineering, and in many cases, this isn’t the most effective strategy. If you have a platform team, SRE team, DevOps team, or other infrastructure engineers, these teams can be a successful place to look for the impetus to grow tracing throughout your software. Consider how problems are communicated and managed in your engineering organization. Who has performance management as part of their portfolio? These can be allies and advocates for the initial implementation of tracing across all your services.
If your SRE team is using tools such as launch checklists, add tracing compatibility to the checklist and start to roll it out that way. You should also consider how your tracing is performing when you’re performing postmortems on incidents—were there services that weren’t traced that should have been? Was there data that was critical to resolving the incident that wasn’t present in the spans? Instrumentation beyond the basics can also be a defined goal for your teams that’s measured like any other aspect of code quality. It’s also useful to track improvements to instrumentation rather than simply adding new services—effective instrumentation is just as important as ubiquitous instrumentation.
Ensure that a process exists for end users of your traces to suggest improvements, especially to shared libraries, in order to drive continuous improvement. Pay careful attention to existing instrumentation code during refactors, especially refactors that modify instrumentation itself. You don’t want to lose resolution on your traces because someone removed spans accidentally! This is an area where building tests around your instrumentation is valuable, as you can easily compare the state of your traces before and after changes, and automatically warn or notify developers of unexpected differences.
Ultimately, instrumentation is a critical part of distributed tracing, but it’s only the first step. Without instrumentation, you’re not going to have the necessary trace data to actually observe and understand requests as they move through your system. Once you’ve instrumented your services, you’ll suddenly be presented with a fire hose of data. How can you collect and analyze that data in order to discover insights and performance information about your services in aggregate? Over the next few chapters, we’ll discuss the art of collecting and storing trace data.
Get Distributed Tracing in Practice now with the O’Reilly learning platform.
O’Reilly members experience books, live events, courses curated by job role, and more from O’Reilly and nearly 200 top publishers.

