Chapter 4. Tying It All Together
As more businesses experience devastating production incidents, they are recognizing that they need to change, and are working to implement Effective Performance Engineering practices. They’re restructuring their teams and redefining jobs such that some team members are focused on ensuring that the essential computer infrastructure and applications deliver good, stable performance at all times. They’re embracing practices in Performance Engineering and treating them as critical, adopting an organizational culture supporting this transformation, and rewarding individuals for their contributions.
Keep in mind that Performance Engineering doesn’t refer only to a specific job, such as a “performance engineer.” More generally, it refers to the set of skills and practices that are gradually being understood across organizations that focus on achieving higher levels of performance in technology, in the business, and for end users.
Many naive observers often take the same attitude toward Performance Engineering: it’s simply a matter of making sure the systems run fast. If possible, make them run really fast. When in doubt, just make them run really, really fast. And if that doesn’t work right away, throw money at the problem by buying more hardware to make the systems go really fast.
But just as there’s more to winning a track meet than being fast, there’s more to building a constellation of quick, efficient web servers and databases than being fast. Just as athletes can’t win without a sophisticated mixture of strategy, form, attitude, tactics, and speed, Performance Engineering requires a good collection of metrics and tools to deliver the desired business results. When they’re combined correctly, the results are systems that satisfy both customers and employees, enabling everyone on the team to win.
Metrics for Success
One critical element of integrating a Performance Engineering culture within an organization is to determine what performance metrics you need to track and assess whether you can measure them with confidence.
How often do we hear development and testing organizations and even managers refer to lines of code written, scripts passed and executed, defects discovered, and test use cases as a measure of their commitment to software quality?
At the end of the day, these measurements are useless when it comes to delivering results that matter to your end users, that keep them coming back for more of your products and services. Think about it. Who cares how many defects you’ve found in pre-production? What does that measure?
We want to make a fairly bold statement: these old, standalone test metrics don’t matter anymore.
When it comes to quality in development, testing, and overall operations, these are the questions you should be asking yourself:
-
How many stories have we committed to?
-
How many of these were delivered with high quality to the end user?
-
How much time did it take to deliver from business or customer concept to production?
Finally, ask yourself this: “Are our end users consuming the capabilities they asked for?”
Activities Versus Results
The difference between this sort of focus and a purely technical focus is the difference between activities and results. If our team commits to 80 story points at the beginning of a 4-week sprint but we deliver only 60, then we’re not meeting our commitment to ourselves, the business, or the customer. It also means our team is preventing another team from delivering on their commitments. The release will instead be put on hold and pushed to our next release. Ultimately, the business results are going to be less than what we promised.
Over the last several years, improvements in development and testing have provided an opportunity for organizations to apply new metrics that can lead to genuine transformation. The most common of these proven concepts is Agile development practices. When executed well, Agile methods can enable a team to quickly deliver high-quality software with a focus on the highest priority for the business and end user. As teams transform, having a few key measurements and producing results helps the organization evolve in an informed manner, with continuous feedback from the investments they’re making.
Without these types of metrics, organizations will simply attempt their transformation blindly, with limited capacity to show results, including the business outcomes demanded of today’s technology organizations.
Top Five Software Quality Metrics
Here are the top five quality metrics that really matter:
- Committed stories versus delivered results meeting doneness criteria
Remember the last time someone committed to do something for you and either failed to deliver or didn’t meet your standards? It caused delays and extra work, along with a lot of frustration. In software development, stories are the pieces of work that are committed to and, ideally, delivered on time and to a certain spec.
As you may know, stories represent the simple, high-level descriptions that form a use case, such as a user inserting a credit card into an airline kiosk. Each story needs to be delivered at a specific level of quality or “doneness” criteria. As teams continuously plan, elaborate, plan again, commit, and deliver, the ultimate goal should be to deliver these results in alignment with the broader team’s doneness criteria. When that can be measured, the team can showcase its abilities to meet its commitments on schedule and with the highest standards.
- Quality across the lifecycle
The demand for software delivery speed continues to increase along with the demand for reduced costs. But how can you achieve these goals when you don’t have the time and resources to manually test every build? When you can’t afford to wait and find those defects in your late-stage releases? The answer is to follow the build lifecycle from story to code on a developer desktop. Next, you should check, build, and unit test. Continue by using automation through the rest of the process, including automated functional, performance, security, and other modes of testing. This enables teams to show the quality of a build throughout the lifecycle with quality metrics and automated pass/fail gates.
Given the frequency of these builds and automated tests, build-life results can be created and measured in seconds, minutes, and hours. Now, your most frequent tests are fully automated, and you’re only doing manual tests on the highest quality releases that make it through the automated lifecycle. This results in automated build-life quality metrics that cover the full lifecycle, enabling your team to deliver with speed and quality, while reducing costs through higher efficiency.
- Production incidents over time and recurrence
Just as it’s important to show the quality of the release over time, it’s also important to minimize production incidents and their recurrence over subsequent releases. Table 4-1 illustrates a technique we’ve used to compare team performance over time. Imagine you are working with five teams over three completed releases; this shows how an information radiator can be used with simple and minimal key data to visually represent important results, such as “% Commit Done” and “# Prod Incidents,” delivered across teams.
The target for this typical (though imaginary) organization is 95% of committed stories delivered and zero production incidents. Teams that didn’t meet these goals are highlighted in bold red. Often, production incident numbers are found within an incident management process. Defining the root cause and implementing corrective measures enables continuous improvement and prevents recurrence of the same issue in subsequent releases. With these quality metrics in place, you can learn which teams meet specific goals. Finally, you can look across teams and discover why proven concepts work.
| Teams | Releases | |||||
|---|---|---|---|---|---|---|
| Team Averages | 2016-Jan | 2016-Feb | 2016-Mar | 2016-Apr | ||
| % Commit Done | Alpha | 97% | 96% | 98% | 97% | |
| # Prod Incidents | 2 | 1 | 0 | 1 | ||
| % Commit Done | Beta | 94.33% | 92% | 95% | 96% | |
| # Prod Incidents | 6 | 3 | 2 | 1 | ||
| % Commit Done | Gamma | 100% | 100% | 100% | 100% | |
| # Prod Incidents | 1 | 0 | 0 | 1 | ||
| % Commit Done | Delta | 93.33% | 100% | 100% | 80% | |
| # Prod Incidents | 2 | 0 | 0 | 2 | ||
| % Commit Done | Epsilon | 92.33% | 85% | 95% | 97% | |
| # Prod Incidents | 1 | 0 | 0 | 1 | ||
| % Commit Done | Totals | 95.398% | 94.6% | 97.6% | 94% | |
| # Prod Incidents | 12 | 4 | 2 | 6 | ||
- User sentiment
Get to know your end users by measuring how they feel when interacting with an application or system. By capturing and dissecting the feedback they provide regarding new or improved capabilities, you can incorporate their needs into an upcoming sprint. At the very least, you can develop a plan to deliver something in response to those needs.
On a larger scale, your analysis and incorporation of user sentiment can expand to a more general market sentiment, which can broaden your impact and market presence. Several components of quality can be covered via this metric, including simplicity, stability, usability, and brand value.
- Continuous improvement
Following retrospectives, allow time and effort to implement prioritized, continuous improvement stories. This enables the team to self-organize and be accountable for improving the quality of their process. When you allocate this time and make it visible to all, the team and stakeholders can show their immediate impact. They can demonstrate how one team, compared to others, has delivered results at increased speed, with higher quality and value to the end user. This allows team leads to ask and possibly answer these questions: are there certain practices that need to be shared? How do teams perform over time with certain changes injected? The continuous improvement metric can also justify recent or proposed investments in the team.
What Really Matters
It’s amazing to see how many teams are still working the old-fashioned way. In fact, the empathy and sympathy poured out from others in the field is overwhelming. We hear and share the same stories we shared 20+ years ago. For example, have you heard this lately, “I have 3,896 test cases, and I’m 30% complete on test execution”? We should all ask, “So, what does that mean for time, quality, and cost, along with on-time delivery to the end user?” It’s genuinely shocking when we hear from a VP about their mobile-testing process, only to learn that the company’s mobile strategy is a “mobile guy” who does manual testing by putting the application on his phone and playing with it—maybe even wrapping it in aluminum foil and walking up and down some hills or taking the elevator to simulate real-world users and weak network conditions.
Let’s start focusing on metrics that really matter. We need results that center on the value and quality we deliver to our end users. In the process, let’s not forget how to deliver. We need teams to contribute creatively and improve the practices they have, while measuring quality via metrics they can use to evaluate, modify, and improve processes over time.
What happens when we insist on the old style of quality metrics?
Well, for one thing, it helps explain why so many CIOs hold their positions for less than two years or why a third of them lose their jobs after a failed project. We’ve seen this before: a new CIO or senior leader comes in, fires a few mid-level managers, reorganizes a couple of things, and brings in a new partner, and suddenly they’re trying to measure results. Unfortunately, they don’t have the right metrics in place to show how the team is delivering. Command and control fails again. Sadly, this fails the business, shareholders, passionate individuals, and ultimately the end user: the customer.
You do not want to fail your customer.
Other Performance Engineering Metrics
The top five quality metrics are a foundational and important starting point for Effective Performance Engineering. In addition, there are a variety of other Performance Engineering metrics that come into play:
-
Release quality
-
Throughput
-
Workflow and transaction response time
-
Automated performance regression success rate
-
Forecasted release confidence and quality level
-
Breaking point versus current production as a multiplier
-
Defect density
This drive to explore new metrics and find better ways of understanding how software is succeeding (and failing) is going to continue and grow even more intense. Software engineers understand that it’s not enough to simply focus on the narrow job of going fast. The challenge is capturing just how the software is helping the company, its employees, and its customers. If they succeed, then the software is a success.
There are big differences in the ways companies are approaching the challenge. They’re mixing enterprise, commercial, and open source tools, and using a wide range of metrics to understand their results. We’ve seen key metrics that are accepted by all groups of stakeholders—metrics that all businesses can start using today. However, there’s nothing like enabling the team to also measure what matters to them, because what matters to your team may matter deeply to your success.
Automation
Automation can mean different things to different people. In this section, we explore why performance testing is not enough, investigate the four key areas to focus on as a performance engineer, and discuss how to apply these practices in the real world. You will see how automation plays a critically important role in Performance Engineering.
Performance Testing Isn’t Enough
Software, hardware, and the needs of application users have all changed radically in recent years, so why are the best practices many developers use to ensure software quality seemingly frozen in time? The world has evolved toward Performance Engineering, but too many developers still rely on performance testing alone. This can lead to disaster.
The initial failures of the Healthcare.gov website revealed how fragile underlying systems and integrated dependencies can be. Simple performance testing isn’t enough. If you don’t develop and test using a Performance Engineering approach, the results can be both costly and ineffective.
What went wrong with Healthcare.gov? A report in Forbes cited these eight reasons for the site’s massive failure:
-
Unrealistic requirements
-
Technical complexity
-
Integration responsibility
-
Fragmented authority
-
Loose metrics
-
Inadequate testing
-
Aggressive schedules
-
Administrative blindness
President Obama, the CEO in this scenario, received widespread criticism over the troubled launch, which should have been a high point for his presidency. Instead, the site’s poor performance tainted the public’s perception of the program. When you embarrass your boss, you don’t always get a second chance. In the case of Healthcare.gov, the Obama administration had to bring in new blood.
So, how do failures like this happen?
When developers and testers were working in a mainframe or client-server environment, the traditional performance testing practices were good enough. As the evolution of technology accelerated, however, teams have had to work with a mix of on-premises, third-party, and other cloud-based services, and components over which they often have little or no control. Meanwhile, users increasingly expect quick access anywhere, anytime, and on any device.
Four Key Areas of Focus
Performance Engineering practices help developers and testers solve these problems and mitigate risks by focusing on high performance and delivering valuable capabilities to the business.
The key is to start by focusing on four key areas:
-
Building in continuous business feedback and improvement. You accomplish this by integrating a continuous feedback and improvement loop into the process right from the beginning.
-
Developing a simple and lightweight process that enables automated, built-in performance. In this way, the application, system, and infrastructure are optimized throughout the process.
-
Optimizing applications for business needs.
-
Focusing on quality.
Applying the four key areas
Your team can head off unrealistic requirements by asking for and using feedback and improvement recommendations. To avoid technical complexity, your team must share a common goal to quickly define, overcome, and verify that all systems are engineered with resiliency and optimized for business and customer needs. Integration responsibility must be built into all environments, along with end-to-end automated performance validation. This should even include simulations for services and components that are not yet available.
The issue of fragmented authority won’t come up if you create a collaborative and interactive team, and you can avoid the problem of loose metrics by using metrics that provide stakeholders the information they need to make informed business decisions. Inadequate testing will never be an issue if you build in automated testing, including functional testing for:
-
Performance
-
Security
-
Usability
-
Disaster recovery
-
Capacity planning
Overly aggressive schedules are unlikely to occur if you provide automated quality results reports that highlight risks and offer optimization recommendations to support informed decision making. Finally, to prevent administrative blindness, focus on business outcomes, communicate with all stakeholders throughout the process, and build in accountability and responsibility for delivery.
It’s your responsibility to ensure that your organization is moving from antiquated methodologies based on performance testing only to more comprehensive Performance Engineering practices. After all, no one wants to be the next Healthcare.gov.
Big Data for Performance
Performance Engineering has long been a practice adopted in the world of high-performance automotive. One of the results we often see in our “Performance Engineering” Google Alert is Lingenfelter Performance Engineering. When you go to the “About us” section of their website, it states:
Lingenfelter Performance Engineering was founded over 43 years ago and is a globally recognized brand in the performance engineering industry. The company offers engine building, engine and chassis tuning components and installation for vehicle owners; component product development; services to manufacturers, aftermarket and original equipment suppliers; prototype and preparation of product development vehicles; late product life-cycle performance improvements; durability testing; and show and media event vehicles.
Looking at high-performance automotive organizations like Lingenfelter (and many others), it is easy to see a direct correlation between all of the components and engineered elements that make a high-performance automobile and these of our business systems (and between their drivers and our end users). The parallel that we want you to recognize is the now available “Big Data for Performance,” which the high-performance automotive industry has been leveraging for many years, yet we as Performance Engineers are only starting to utilize. This big data and the accompanying predictive analytics, both of which leverage the capabilities of Performance Engineering, will enable us to best support our businesses and end users through technology.
To finish out this analogy, do organizations like Lingenfelter only wait until final deployment to see how the automobile they are optimizing will perform? No, they have adopted practices for looking as a team at each component along the way, making decisions, and optimizing the components based on data to ensure they are high quality.
Performance as a Team Sport
Over the last few years, organizations have started to define and embrace the capabilities of Performance Engineering, recognizing that their systems are growing so complex that it’s not enough to simply tell the computers or the individuals behind them to “run fast.” This capability must be built into the organization’s culture and behavior, and it must include activities for developers, database administrators, designers, and all stakeholders—each coordinating to orchestrate a system that works well, starting early in the lifecycle and building it in throughout. Each of the parts may be good enough on its own, but without the attention of good engineering practices, they won’t work well enough together.
Market Solutions
As you look across the market, you will see there are a number of analysts, partners, and software tool vendors actively marketing their Performance Engineering capabilities.
To simplify the decision-making and implementation process for you, we’ve provided some Performance Engineering topics with links to key information at http://www.effectiveperformanceengineering.com.
In addition, we’ve included the results of a Performance Engineering survey that gives a lot more detail about what is going on in the market now.
Performance Engineering Survey Results
Hewlett Packard Enterprise has been working to support Performance Engineering in all organizations. In 2015, it contracted YouGov, an independent research organization, to survey 400 engineers and managers to understand how organizations are using tools and metrics to measure and evolve their Performance Engineering practices. The survey was conducted blind so that no one knew that Hewlett Packard Enterprise commissioned it.
The sample consisted of 50% performance engineers and performance testers, 25% application development managers, and 25% IT operations managers. All came from companies with at least 500 employees in the US. The results reveal a wide range of techniques and broad approaches to Performance Engineering and some of the practices through which organizations are using tools and metrics.
The survey asked, “When you look to the future of Performance Engineering, what types of tools do you and your stakeholders plan to acquire?” In response, 52% of large companies (those with 10,000+ employees) indicated “more enterprise and proven” tools; 37% of the larger companies said they expected “more open source and home-grown”; and the remaining 11% said they were planning “more hybrid of open source and enterprise.” The responses from companies of different sizes followed a similar pattern, but with a bit more balance (see Figure 4-1).
When the results were analyzed based on roles, the majority of respondents planned to acquire “more enterprise and proven” tools, with those identifying as “performance engineer/performance tester” (41%), application development manager (44%), and IT operations manager (51%), as shown in Figure 4-2.
When it comes to testing, an increasing number of companies are concentrating on burst testing to push their software closer to the breaking point. They’re spinning up a large number of virtual users and then pointing them at the systems under test in a large burst over a period of time. This simulates heavy traffic generated from sales, promotions, big events, or retail days like Black Friday or Cyber Monday, when a heavy load can wreak havoc on a system (Figure 4-3).
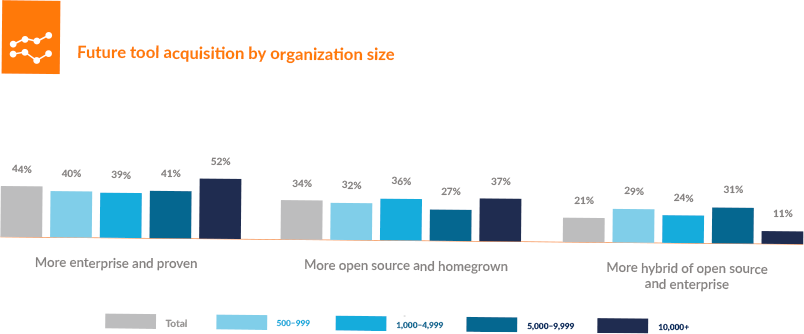
Figure 4-1. Future tool acquisition by organization size
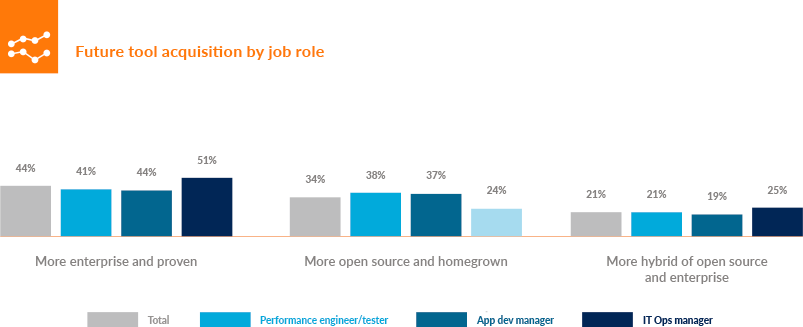
Figure 4-2. Future tool acquisition by job role
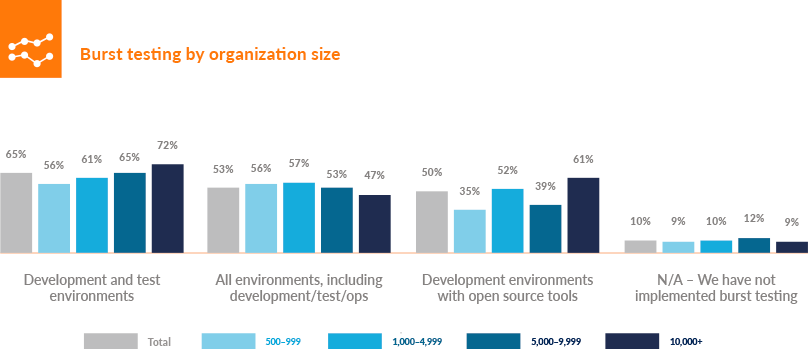
Figure 4-3. Burst testing by organization size
One of the most important options among tools like the ones just cited is the ability to deploy an army of machines to poke and prod at an organization’s systems. The cloud is often the best source for these machines, because many modern cloud companies rent virtual machines by the minute. Those working on performance tests can start up a test for a short amount of time and pay only for the minutes they use.
The value of the cloud is obvious in the answers to the questions about the average size and duration of a load test. Only 3% of respondents reported testing with fewer than 100 simulated users. At least 80% of the respondents used 500 or more users, and 14% wanted to test their software with at least 10,000 users. They feel that this is the only way to be prepared for the number of real users coming their way when the software is deployed (Figure 4-4).
Growth in load testing points to the cloud.
This demand will almost certainly increase. When asked how big they expect their load tests to be in just two years, 27% of respondents said that they expect they’ll need at least 10,000 simulated users. They mentioned much larger numbers, too; 8% predicted they’ll be running tests with more than 100,000 simulated users, and 2% could foresee tests with 500,000 users or more.
While the number of simulated users is growing, duration isn’t long enough to make a dedicated test facility economical. The tests are usually not very long; only 8% reported running tests that routinely lasted more than 24 hours. Most of the survey respondents (54%) said that their tests ran between 4 and 12 hours (Figure 4-5).
The largest companies are also the ones that are most likely to be using the cloud. Only 9% said that they don’t use the cloud for testing, typically because their security policies didn’t permit them to expose their data to the cloud (Figure 4-6).
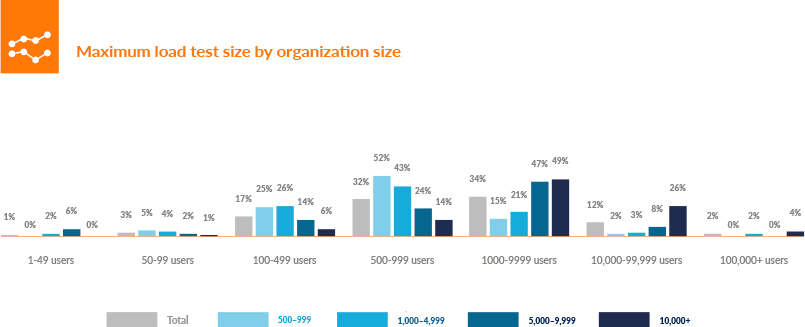
Figure 4-4. Maximum load test size by organization size
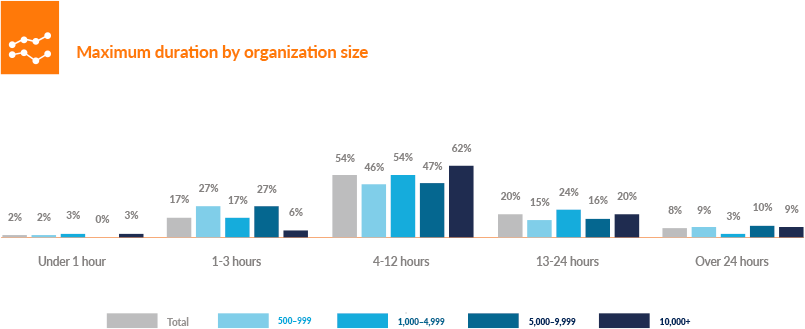
Figure 4-5. Maximum duration by organization size
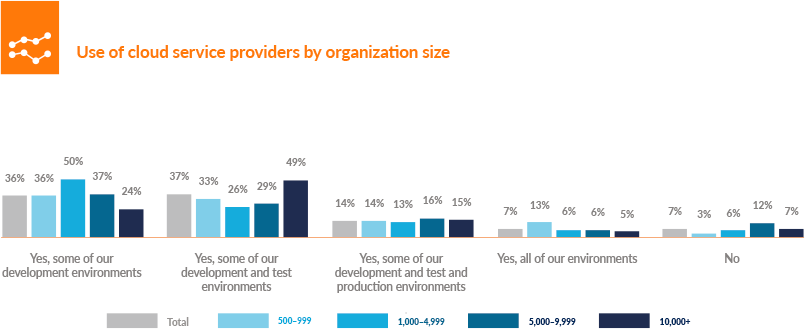
Figure 4-6. Use of cloud service providers by organization site
How to Choose a Solution
Now comes the time for you to start defining what a solution looks like for you. As you begin, we suggest you take a three-step approach: define your goals and objectives, define a timeline, and identify partners. In the following sections, we go through this process in a bit more detail, so you can get started on your path to choosing your Performance Engineering solution.
Define your goals and objectives
Transforming is a complex exercise and one that should have some thought behind it. When thinking about goals and objectives, begin with five key aspects of your teams and organization:
-
Culture
-
Technology
-
Speed
-
Quality
-
Cost
Each of these considerations factors into the overall goals and objectives for Effective Performance Engineering, and decisions must be made now.
It is a journey and will take some time, and the path will not always be straight; however, getting started in a focused area with some support, adopting a few key practices, and sharing the results is the right approach.
Celebrate the success, examine the results, and then continue along the journey, never losing sight of the end user. With this collaboration and continued guidance and direction, you’ll attain success and make forward progress, as you transform into an Effective Performance Engineering organization.
Define your timeline
Timelines are relative. By contrast, value to your end users and stakeholders is more objective and within your control, so you should focus on defining what is important there before setting your timelines.
From a purely leadership and budget/time perspective, it is important to define a timeline with clear goals and objectives within the given budgetary cycle. Doing so enables you to share and communicate results delivered in the prior period, activities being performed in the current period with their forecasted results, and commitments for the future period with their forecasted results.
A timeline should visually represent key milestones along with incremental measures indicating what should be achieved within these milestones. It should also map each task or activity to the value it will deliver to the end user and business.
Figure 4-7 illustrates what this could look like at a high level for you and your organization on your journey to Effective Performance Engineering.
Identify your partners
Partners and thought leaders are often a great resource to provide additional insight, experience, and practical advice from the market, in order to get you aligned with current trends and able to accelerate as desired.
Next we take a deeper look at some thought leaders, consulting partners, and analyst partners, with specific details and links to existing capabilities and assets, so you can quickly get a better and broader idea of some of the Effective Performance Engineering resources available to you.
Top thought leaders of today
Microsoft, Google, IBM, Apple, and Hewlett Packard Enterprise comprise the set of top five thought leaders and influencers around Performance Engineering and testing today.
This set of five is consistent by audience (performance engineers/testers, application development managers, and IT operations managers), as well as by organization size (Figure 4-8).
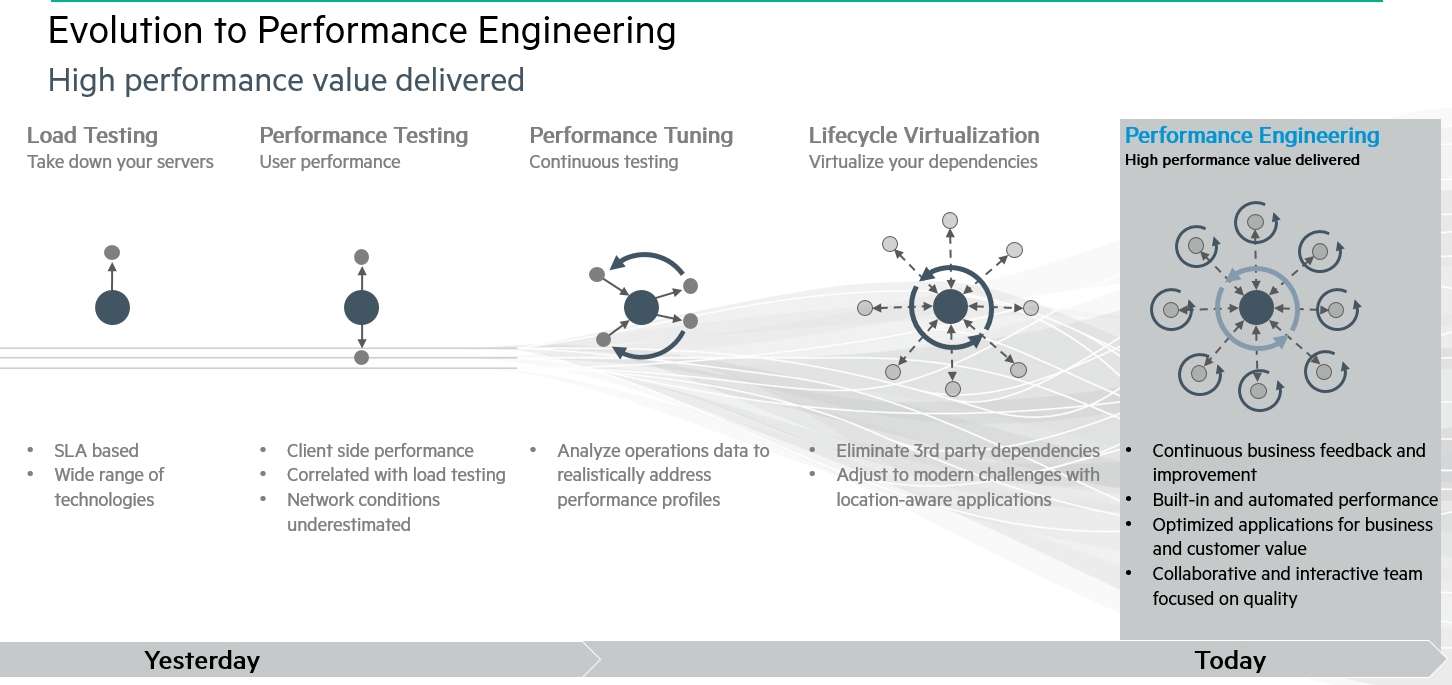
Figure 4-7. Evolution of Performance Engineering
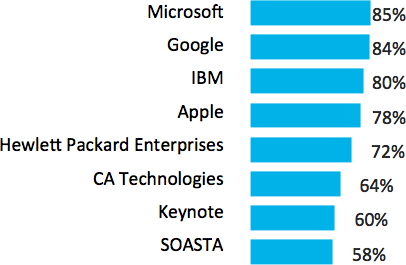
Figure 4-8. Top thought leaders
Preferred partners for Performance Engineering
Accenture, Infosys, Deloitte, HCL, and Tech Mahindra are the top five service providers most often chosen as Performance Engineering partners by the organizations surveyed.
Note that “None of the Above” only represented 7% of all other responses (Figure 4-9).
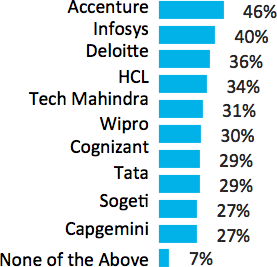
Figure 4-9. Preferred partners
Conclusion
Performance Engineering practices define a culture that enables teams to deliver fast, efficient, and responsive systems architected for large-scale populations of customers, employees, regulators, managers, and more. The careful application of these principles makes it possible for corporations to please customers, support employees, and boost revenues, all at the same time.
There is more to Performance Engineering than just testing. Done right, Performance Engineering means understanding how all the parts of the system fit together, and building in performance from the first design.
Making the journey from performance testing to Performance Engineering isn’t easy. But the proven practices established over years of observation can help you on your way.
The Path to Performance Engineering
One of the first tasks that budding programmers are given is to write a program that produces the text “Hello world.”
Next you start to play with the program and try to do more, to see how quickly it delivers data or answers queries, and try to optimize for the highest performance with the least amount of code. The requests come in, the responses go out, and you see results on a screen. Take this and add a long-time run script for performance testing, a script you run every time you push out your latest release. It’s pretty easy when you’re the author and the user.
Performance Engineering, though, is a broad set of processes, and it’s also a culture. Performance Engineering is an art based on years of observation that have led to proven practices.
But moving from performance testing to Performance Engineering isn’t an easy process. The team must be ready to move from simply running a checkbox performance test script and focusing on parts to studying the way that all parts of the system work together. These pieces encompass hardware, software, configuration, performance, security, usability, business value, and the customer. The process is about collaborating and iterating on the highest-value items, and delivering them quickly, at high quality, so you can exceed the expectations of your end user.
Here’s a roadmap for making the trip from performance testing to Performance Engineering. Essentially, these are the steps to become a hero and change agent—and how you can enable your organization to deliver with proven Performance Engineering practices and the accompanying culture.
Define a culture
The success of a team depends heavily on the way leaders are nurturing the professional environment and enabling individuals to collaborate. Building this type of environment will inspire the formation of cross-functional teams and logical thinking.
Build a team
A Performance Engineering team means that technology, business, and user representatives work together. They focus on the performance nature of everything they’re working on and figure out together how they can build in these capabilities. They need to know what specific area to focus on first, as well as how to measure along the way. They need to agree on the desired outcome. They must constantly remind themselves that the end goal of adopting Performance Engineering is to benefit the organization and end user.
Choose metrics
We often encourage teams to start with a manual metrics process, perhaps a whiteboard (we know, not really high tech for a technologist) and a few key metrics, then measure them over time and see why they matter (or don’t). You’ll quickly get a core set of metrics that matter for you and your organization, which have grown out of your cross-functional teams. Your people have the passion and understanding behind these, so trust them. They offer a good way to judge results against the desired outcome.
Once you have figured out enough of this manually, and individuals are starting to adopt and believe in them, take a look at your existing technology capabilities and see how you can get to automated reporting of these results fairly simply. These metrics will be key to your way of measuring what you do and the results you’re able to deliver. Make sure you have a solid baseline, and take regular measurements.
Add technology
Performance Engineering requires a new way of thinking, related to your existing software and infrastructure, including the existing tools and capabilities. This is how you shape and form quick, automated results.
Define what your scope of effort is going to be and quickly learn what technology capabilities you already have available to you and your team. This will be an interesting experience, because you’ll learn about the capabilities that other siloed teams have available to them. Now, with a shared vision of how you want to deliver Performance Engineering throughout the organization, you can leverage the technology to launch a single approach that aggregates these capabilities.
Perhaps there are a few technology areas you want to start thinking about from the lifecycle virtualization space, such as user virtualization, service virtualization, network virtualization, and data virtualization. These are the core capabilities that will enable your team to accelerate the transformation to Performance Engineering.
Build in telemetry
Now that you’ve started with culture, team, and technology, it’s time to start integrating the telemetry and its data.
For example, how are you capturing the APM (application performance monitoring) data from production, and how about pre-production? Can you begin to examine these results and understand more about the behavior patterns of your users, systems, and transactions? From a cross-functional perspective, this will also pique the interest of the IT operations manager; so you’ll continue to broaden your network, and you’ll enable them to reduce the number of production incidents. This is just one example.
Think about other quick wins or simple integrations for your existing technology that will enable you to build more bridges. Correlate these types of results across your team so you can promote the culture and desired outcomes of Performance Engineering by building in telemetry.
Look for indirect metrics
There are hundreds of metrics available that you can use to estimate the success of a new capability or feature being released. As systems take on more roles inside a company, metrics that track performance become more readily available, and these enable you to begin partnering with your business peers to find out what metrics they watch and how they get these results.
Start looking at and asking about indirect metrics within the business that would show results related to revenue, customers (attraction and retention), competitive advantage, and brand value. These are important to measure as you make the transition to Performance Engineering.
Focus on stakeholders
Get to know your stakeholders. Who on your team has the most interest in delivering the highest-value items to the end user most quickly and with great results? Find these people and get to know them well. Remember, you’re looking for your executive-level sponsors and peer champions, so you can transform the practices and culture of an organization to become a Performance Engineering delivery machine.
Start gathering information and sharing initial prototypes for the type of results, reports, and dashboards you want to show to your stakeholders on a regular basis. Typically, this would be a monthly show-and-tell exercise; however, as it matures it may become a set of automated results delivered with every build, consistently available if stakeholders want to review it. Also, you should consider regular, quarterly presentations to the executive board in which you share last quarter’s results, talk about the current quarter, and seek funding for the next one.
Stay focused. Remember your objective. Find your champions. Deliver results.
Create stable environments
One of the earliest challenges will involve enabling teams with the capabilities they require. Some of this will come as you build these teams and the cross-functional tools, capabilities, and associated skills come together. But in the beginning, having a “like production” environment for Performance Engineering is key.
By leveraging the aforementioned lifecycle virtualization—including user virtualization, service virtualization, network virtualization, and data virtualization—you can quickly re-create production environments at a significant fraction of the cost, and you can duplicate them as many times as required. There are several other stable environment proven practices that have emerged along the way, which you can also learn and share through others.
Celebrate wins
Remember the old forming, storming, norming, and performing program developed by Bruce Tuckman? He believed these were the four phases necessary to building teams. If you’re a leader or a team member, you’ll see this in action.
It’s important to remember why you’re doing this, and know it’s all part of the transformation. Stay focused on the business and end-user objectives, so you can measure your progress and keep your eye on the prize.
Just imagine what it will be like once you have delivered these capabilities to your end user. Conduct proper retrospectives, track your progress with your metrics, and celebrate the wins!
Add gamification
As you mature the capabilities just listed, think about how you can add gamification into the results. In other words, how do you make the results you’re delivering fun and visual, and how do you make a positive impact on your end users and the organization in the process?
Rajat Paharia created the gamification industry in 2007. In his book Loyalty 3.0 (McGraw-Hill) Rajat explains, “how to revolutionize customer and employee engagement with Big Data and gamification” and defines these “10 key mechanics of gamification”:
-
Fast feedback
-
Transparency
-
Goals
-
Badges
-
Leveling up
-
Onboarding
-
Competition
-
Collaboration
-
Community
-
Points
Of course, you also want to ensure that you highlight the opportunities for improvement and show the wins and losses. You can also gamify Performance Engineering itself at a team level to encourage a little healthy competition within your group, and well beyond, then broadly share the results. This also enables you to leverage these results as information radiators for all stakeholders, showing how teams, systems, and applications are performing against defined baselines and goals.
Start small
When you first begin to incorporate Performance Engineering, you may be tackling a long-neglected maintenance list, or a new, up-and-coming hot project. Either can benefit from the focus of a Performance Engineering culture. Don’t try to take on too much at first.
As you begin to elaborate on your requirements, stories, and features, it’s important to remember that your whole team is working to define the what, why, and how of each item. As you continue down the Performance Engineering path, you will learn from each other’s domain expertise,” keeping in mind these learnings and results are from small experiments to show quick incremental value.
Start early
Performance Engineering works best when the team starts thinking about it from the beginning. The earlier the team begins addressing performance in the product lifecycle, the likelier it is that the final system will run quickly, smoothly, and efficiently. But if it can’t be done from the very beginning, it’s still possible to add the process to the redesign and reengineering work done to develop the next iteration or generation of a product.
Get Effective Performance Engineering now with the O’Reilly learning platform.
O’Reilly members experience books, live events, courses curated by job role, and more from O’Reilly and nearly 200 top publishers.

