May 2024
Intermediate to advanced
592 pages
13h 44m
English
Excel includes many statistical functions and features to help you generate statistics and analyze data. For example, you can use it to create frequency distributions, generate statistics such as standard deviation and skewness, work with probability distributions, and more. This chapter guides you through these areas, focusing on using functions, PivotTables, and charts.
You have a list of text or numeric values and want to count the number of occurrences of each value.
Suppose you have a list of values in a column and want to find the frequency of each unique value: the number of times it occurs in the column. You can do so by creating a frequency table that lists each value and its corresponding frequency.
The method you choose to create the frequency table depends on the type of values for which you want to find frequencies.
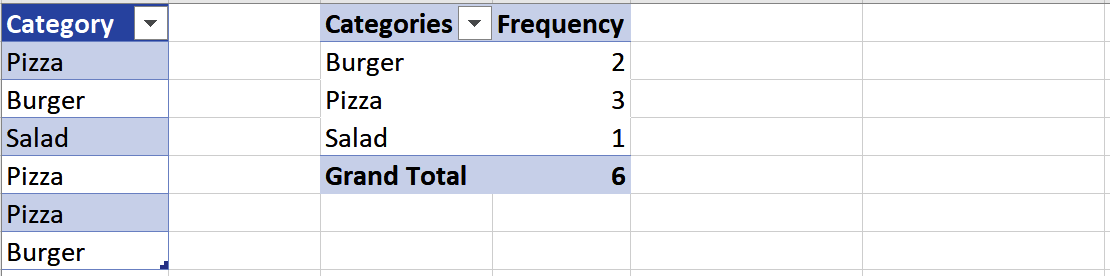
For discrete values such as text or integers, you can create the frequency table using a PivotTable as follows:
Select the data and insert a PivotTable by choosing Insert ⇒ Tables ⇒ PivotTable.
Add the column of values to the PivotTable Fields pane’s Rows and Values sections and make sure the Values aggregation is set to Count (see Recipe 11.9). The results are shown in Figure 8-1.
For continuous ...