Chapter 1. Client-Side
In web development, the client-side is the code that runs on the users’ hardware—either in browsers on their laptops, web views in a mobile app on their phones, or perhaps even in a render engine running on the set-top box in their living rooms.
There is a huge body of written work around improving web performance, beginning with Steve Souders’ seminal book, High Performance Web Sites, but the landscape of client-side performance changes rapidly, in large part because of proactive performance improvements implemented by the browser makers themselves, as well as the work being done at the standards level.
So, as busy product development engineers and engineering leaders, how do we keep up with the changes and reconcile the differences across browsers? One way is to rely on synthetic performance testing using one or more of the tools available today.
Use a Speed Test
Speed tests, or performance testing tools, are applications that load a site and run a battery of tests against it, using a dictionary of performance best practices as the criteria for these tests. These tools are constantly updated and should reflect and test against the current best practices. They keep track of changing practices, so you don’t need to.
Note
Two terms you’ll see around performance testing are synthetic testing and real user metrics. Real user metrics is data gathered from actual users of your site, which you harvest, analyze, and learn from to see what your audience’s actual experience is like. Synthetic testing is when we run tests in a lab to identify performance pitfalls before we release to production. Speed tests are what we would call synthetic tests.
There are many performance testing tools on the market, from browser-integrated tools like YSlow, or free web applications like WebPageTest, to full enterprise solutions. My personal favorite web performance testing tool is WebPageTest.1 You can use the hosted site as is, or, if you want, you can download the project and run it on-premises using so-called private instances, so that you can use it to test your preproduction environments that are usually not publicly accessible.
WebPageTest essentially employs a number of agents around the world that can run a huge variety of devices to go to your site and give you the performance metrics from each run. Figure 1-1 shows the WebPageTest homepage.
Note the Test Location drop-down menu. That’s where you choose your agent. You can use this to choose where the test is run, but also what hardware and operating system on which it is run. You also can choose a number of other options, including the type of connection to use, the different browsers that are available to that particular agent, and whether you want to test just the initial uncached view of the site or also additional cached versions for comparison.
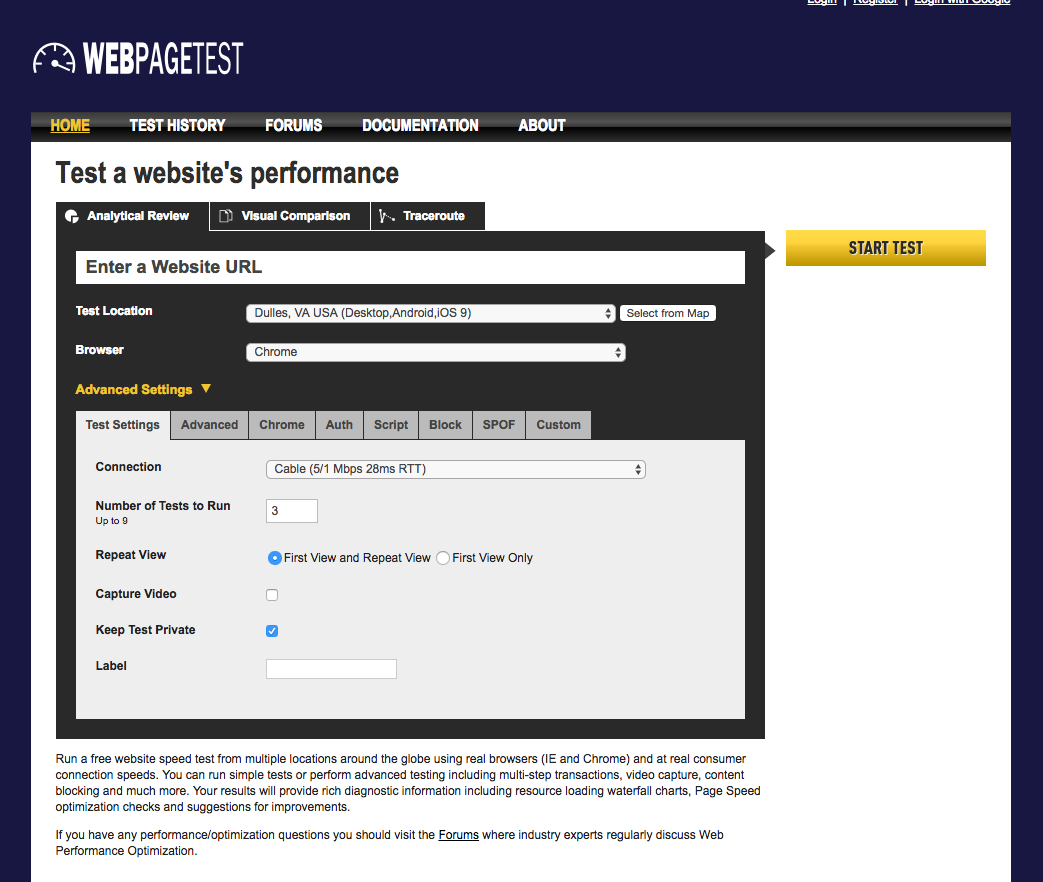
Figure 1-1. The WebPageTest homepage
Each test you run returns results that include the following, among other things:
-
A letter rating of A–F, which describes the site’s performance
-
A high-level readout of your most important metrics such as time to first byte, Speed Index,2 number of HTTP requests, and total size of payload for site (see Figure 1-2)
-
Waterfall charts that show the order and timing of each asset downloaded
-
A chart that shows the ratio of what asset types make up your page’s payload
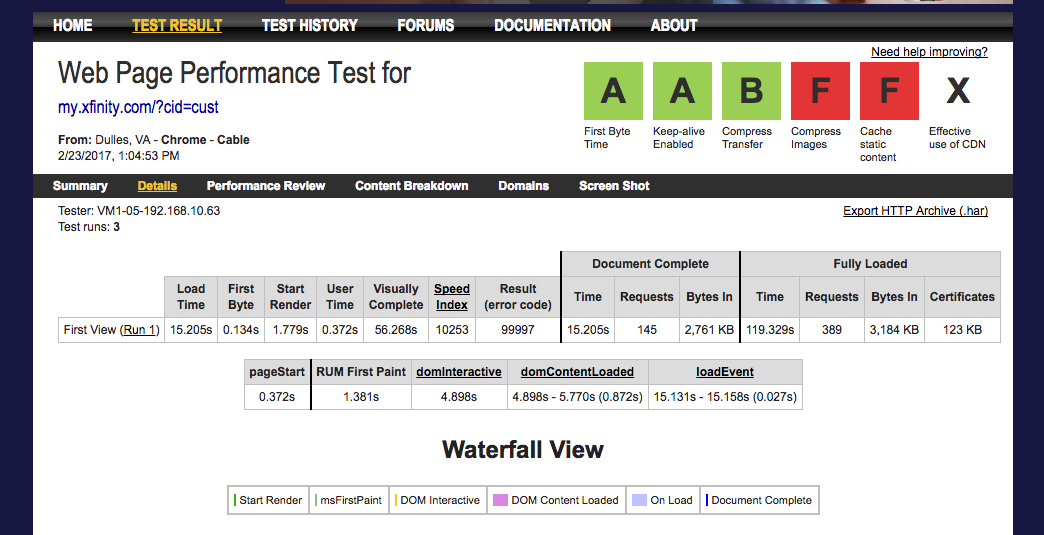
Figure 1-2. The results of my WePageTest run (the F’s in my score are because of content loaded onto my page from an advertising partner)
Also included in your results are details of your rating that outline the items that were flagged against the criteria of the test. These details are essentially a checklist to follow to improve your site’s web performance. See Figure 1-3 for an example of these. Do you come across some images that aren’t compressed? Compress them. Do you notice some files that aren’t served up gzipped? Set up HTTP compression for those responses.
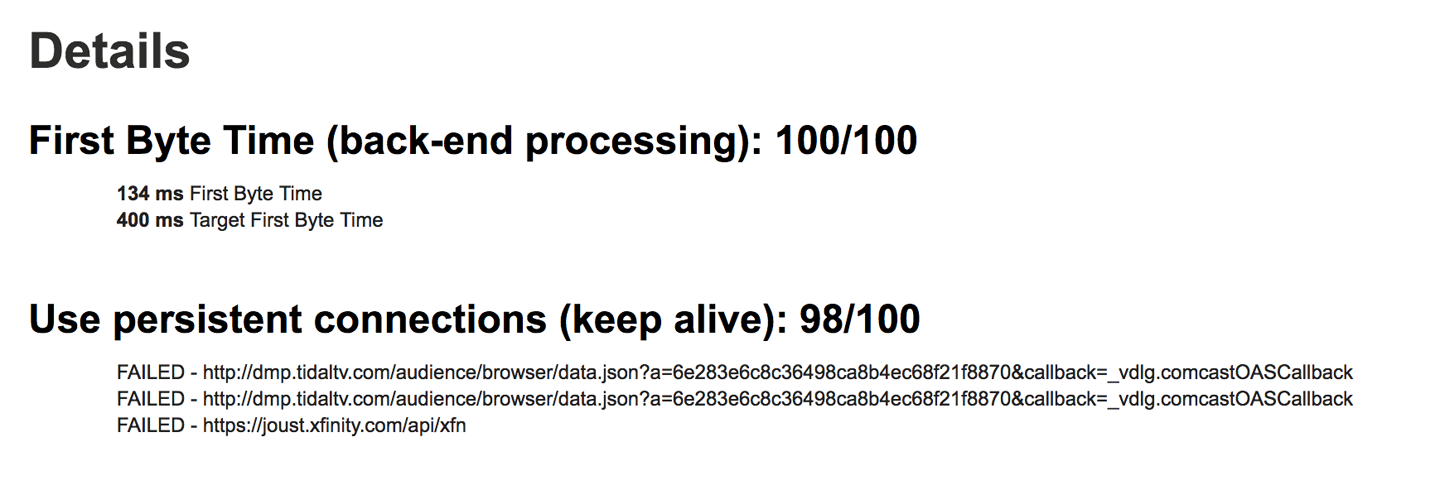
Figure 1-3. Flagged items
Let the tool do the analysis so that you can manage the implementation of its findings.
Now Integrate into Continuous Integration
Performance testing tools are great, but how do you scale them for your organization? It’s not practical to remember to run these tests ad hoc. What you need is a way to integrate them into your existing continuous integration (CI) environment.
Luckily WebPageTest provides an API. All you need is an API key, which you can request at http://www.webpagetest.org/getkey.php.
Using the API, you can write a script in your language of choice and programmatically run tests against WebPageTest. The tests can take a little while to run, so your script will need to poll WebPageTest to check the status of the test until the test is complete. When the test is complete, you can iterate through the response and pull out each result. Figure 1-4 presents a high-level architecture of how this script might function.
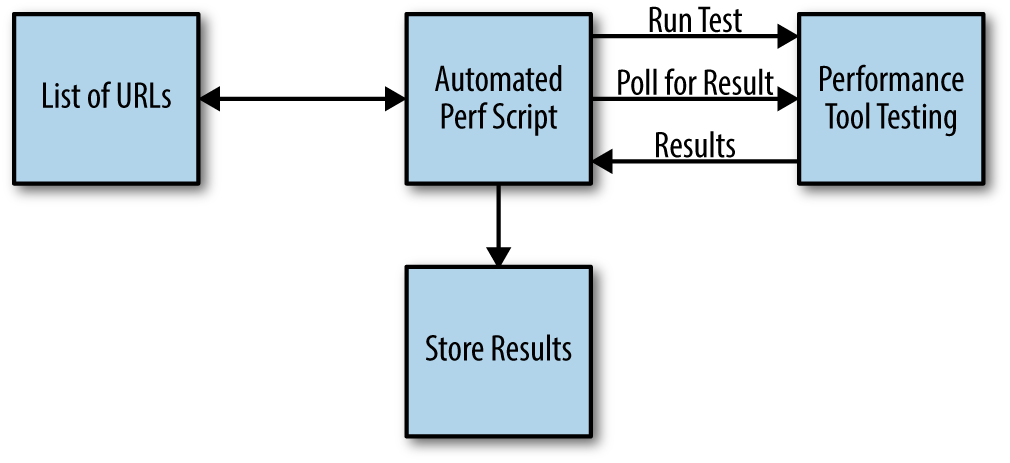
Figure 1-4. High-level architecture of how the script might function
After you have the result, you can do any number of things: you can create charts with those results with a tool such as Grafana (https://grafana.com), you can store them locally, and you can integrate these results into your CI software of choice (see Figure 1-5). Imagine failing a build because the changes introduced a level of latency that you deemed unacceptable and holding that build until the performance impact has been addressed!
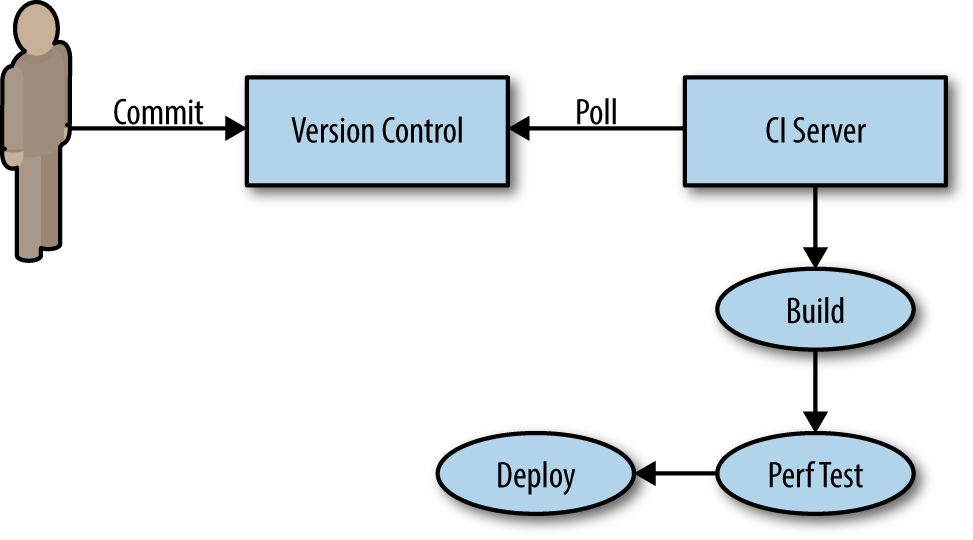
Figure 1-5. Integrating your results into your CI software
Of course, as with anything that breaks the build, the conversations will need to be had around whether the change is worth the impact and do we raise the accepted latency even just temporarily to get this feature out—but still, at least these conversations are happening and the team isn’t trying to figure out what change affected performance after the fact and how to deal with this while your app is live in production.
Use Log Introspection for Real User Monitoring
Note
Real User Monitoring is the practice of recording and examining actual user interactions and deriving the performance data from these interactions. This is generally a more useful metric to report than synthetic results because the numbers reflect real experiences of your actual users.
So, this is great for testing during development, but how do you quantify your performance in production with real users? An answer to that is to use log introspection. Log introspection really just means harvesting your server and error logs into a tool such as Splunk or ELK (Elasticsearch, Logstash, and Kibana), which allows you to query and build monitors, alerts, and dashboards against this data, as illustrated in Figure 1-6.

Figure 1-6. Dashboards, monitors, and alerts against data
But, wait, you might be saying: aren’t logs primarily about monitoring system performance? True, logs are generated on the backend, and traditionally the data in these logs pertain to requests against the server. Although they’re hugely useful to gather HTTP response codes and ascertain fun things like vendor API Service-Level Agreement compliance, they do not naturally lend themselves to capturing client-side performance metrics.
Luckily one of my friends and colleagues, John Riviello, has created an open source JavaScript library named Surf-N-Perf that captures these metrics on the client-side and allows you to feed them to an endpoint you define. Some of these metrics are data points to allow you to see when a page has started to render, when it finishes rendering, or when the DOM is able to accept interaction. These are all key milestones to evaluate a user’s actual experience.
The library uses the performance metrics available to the window.performance object (documentation for which is available at https://w3c.github.io/perf-timing-primer/).
All you need to do after integrating Surf-N-Perf is create an endpoint that takes the request and writes it to your logs, as depicted in Figure 1-7. Preferably, the endpoint should be separate from the main application; this way, if the application is having issues, your logs can still properly record the data.
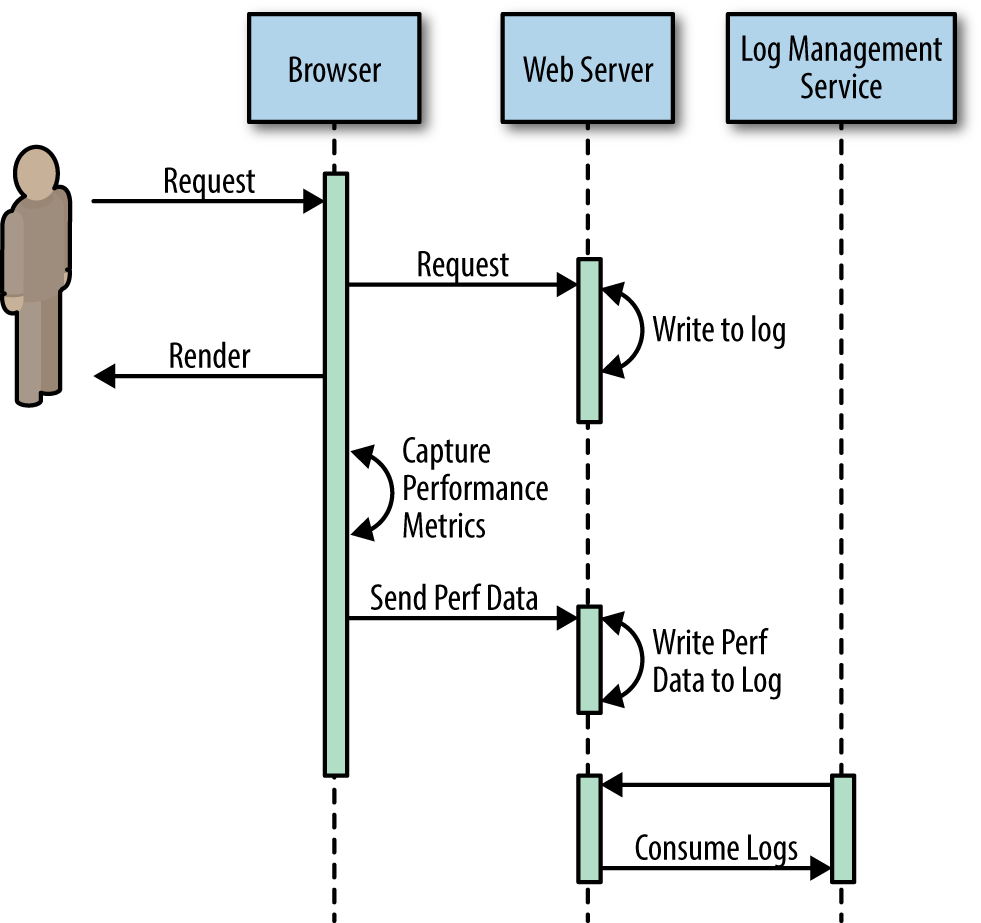
Figure 1-7. Creating an endpoint that takes the request and writes it to your logs
This allows you to see what the actual real performance numbers are for your customers. From there, you can slice this into percentiles and say with certainty what the actual experience is for the vast majority of our users. This also allows you to begin diagnosing and fixing other issues that might not have been caught by your synthetic testing. We talk more about this in Chapter 3.
Tell People!
Your application gets mostly straight A’s in the synthetic tests you run, any performance affecting changes are caught and mitigated before ever getting to production, and your dashboards show subsecond load times for the 99th percentile of your actual users. Congratulations! Now what? Well, first you operationalize, which we talk about in Chapter 3, but after that you advertise your accomplishments!
Chances are, your peers and management won’t proactively notice, though your users and your business unit should. What do you do with all of these fantastic success stories you have accumulated along with the corroborating metrics? Share them.
Incorporate your performance metrics into your regular status updates, all hands, and team meetings. Challenge peer groups to improve their own metrics. Publish your dashboards across your organization. Better performance for everyone only benefits your customers and your company, so collaborate with your business unit to quantify how this improved performance has affected the bottom line and publish that.
Summary
In this chapter, we looked at using speed tests to keep up with the ever-changing landscape of client-side web performance best practices. For extra points, and to realistically scale this for an organization, we talked about automating these tests and integrating these automated tests into our CI environment.
We also talked about utilizing our log introspection software, along with an open source library such a Surf-N-Perf, to capture our actual real user metrics around client-side performance. How we then diagnose and improve those numbers in production is the focus of Chapter 3.
1 Available at https://www.webpagetest.org. This is run by Patrick Meenan and is used to power such sites as the HTTP Archive.
2 You can find more information about Speed Index at https://sites.google.com/a/webpagetest.org/docs/using-webpagetest/metrics/speed-index.
Get Full Stack Web Performance now with the O’Reilly learning platform.
O’Reilly members experience books, live events, courses curated by job role, and more from O’Reilly and nearly 200 top publishers.

