Chapter 3. Operationalize Performance
Your site is out in production; performance is where you want it; everything looks great.
You think.
But how do you quantify what the actual experience is out in the wild? How your machines are performing with real users, using their own devices connected via various networks, each of varied quality? Even more important, how do you identify, triage, and debug an issue in production that is affecting actual customers?
You use an application performance management (APM) tool. There are many such tools out in the market; some of the more popular are New Relic, AppDynamics, and Dynatrace.
Setting Up an APM
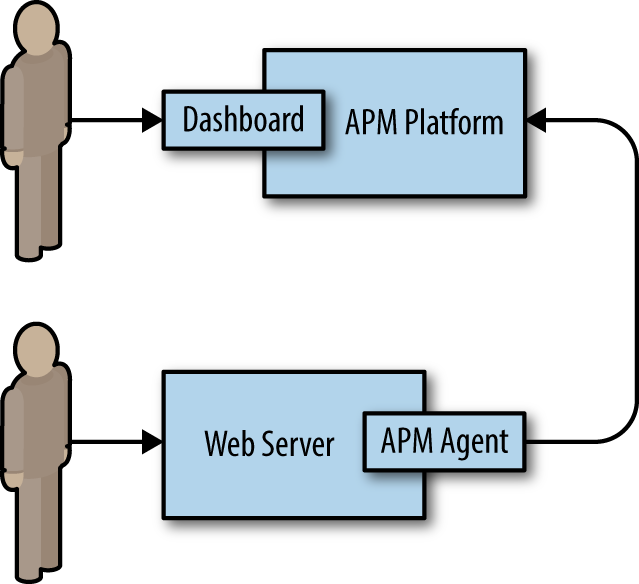
Setting up an APM is relatively painless. Generally, you just install an APM agent on the machines that you want monitored. The agents capture metrics for the machines on which they are installed and communicate those to the hosted APM platform. The APM platform processes the data and makes it available via dashboards. Figure 3-1 presents a diagram of that architecture.

Figure 3-1. The APM platform processes the data and makes it available via dashboards
Using an APM to Troubleshoot Performance Issues
Picture this: you are sitting at your desk when you get a call from one of your stakeholders. They are hearing customer complaints; users are trying to access your site but are experiencing a lot of latency.
Luckily, your site is already being ...
Get Full Stack Web Performance now with the O’Reilly learning platform.
O’Reilly members experience books, live events, courses curated by job role, and more from O’Reilly and nearly 200 top publishers.

