August 2008
Beginner
896 pages
44h 17m
English
This appendix includes statistical tables that are commonly used in testing hypotheses and building confidence intervals. In order of appearance, the tables are:
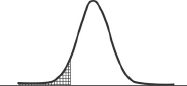
Table 58.B1. Normal Distribution. Panel A: Area Under Standard Normal Distribution from Minus Infinity to α for Values of α< 0
Table 58.B2. Normal Distribution. Panel B: Area under Standard Normal Distribution from Minus Infinity to α for Values of α> 0
Table 58.B3. Critical Values of the Chi-Square (Χ2) Distribution for Given Levels of Probability that the Χ2 Will Exceed Table Entry
Table 58.B4. Critical Values of the t-Distribution for Given Levels of Probability that the t-Value Will Exceed Table Entry
Table 58.B5. F Distribution. Panel A: Critical Values of the F-Distribution for 5% Probability Level (α = 0.05) that the F-Statistic Will Exceed Table Entry
Table 58.B6. F Distribution. Panel B: Critical Values of the F-Distribution for 1% Probability Level (α = 0.01) that the F-Statistic Will Exceed Table Entry
Table B.1. Normal Distribution. Panel A: Area under Standard Normal Distribution from Minus Infinity to α for Values of α< 0
 |
a | 0.00 | 0.01 | 0.02 | 0.03 | 0.04 | 0.05 | 0.06 | 0.07 | 0.08 | 0.09 |
|---|---|---|---|---|---|---|---|---|---|---|
−3.0 | 0.0013 | 0.0014 | 0.0014 | 0.0015 | 0.0015 | 0.0016 | 0.0016 | 0.0017 | 0.0018 | 0.0018 |
−2.9 | 0.0019 | 0.0019 | 0.0020 | 0.0021 | 0.0021 | 0.0022 | 0.0023 | 0.0023 | 0.0024 | 0.0025 |
−2.8 | 0.0026 | 0.0026 | 0.0027 | 0.0028 | 0.0029 | 0.0030 | 0.0031 | 0.0032 | 0.0033 | 0.0034 |
−2.7 | 0.0035 | 0.0036 | 0.0037 | 0.0038 | 0.0039 ... |
Read now
Unlock full access


