Chapter 5. Formatted String Literals: Make Charts from Data

Sometimes it’s the simplest approaches that get the job done.
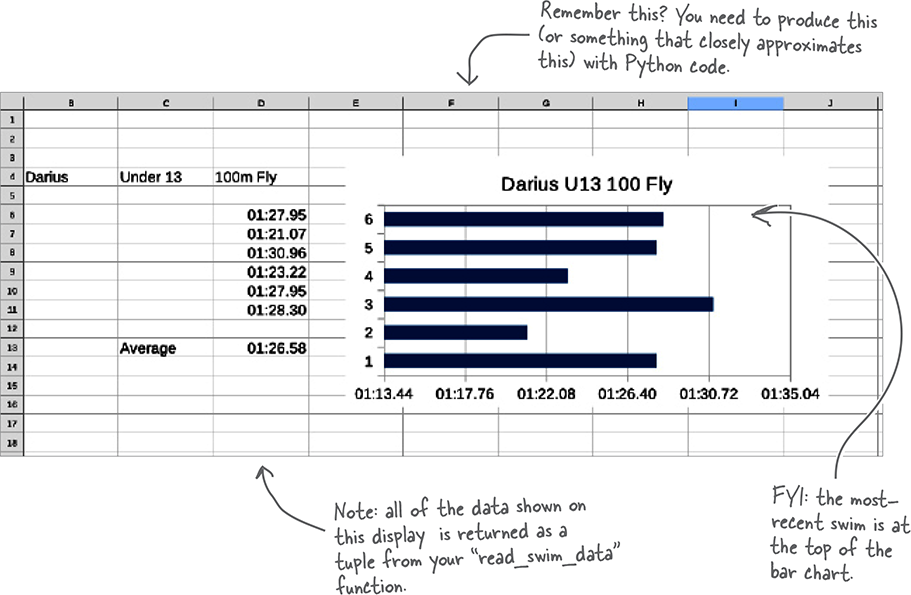
In this chapter you finally get around to producing bar charts for the Coach. You’ll do this using nothing but strings. You already know that Python’s strings come packed full of built-in goodness, and Python’s formatted string literals, aka f-strings, enhance what’s possible in some rather neat ways. It might feel weird that we’re proposing creating bar charts with text but, as you’re about to discover, it’s not as absurd as it sounds. Along the way you’ll use Python to create files as well as launch a web browser with just a few lines of code. Finally, the Coach gets his wish: the automatic generation of charts from his swim times data. Let’s get to it!

That’s great to hear, as we have all the data we need.
Now all we have to do is work out how to turn the data into a bar chart.


So do we.
There’s no other choice. It’s time for a sit down with The Coach.