Chapter 4. Images on the Canvas
Like the Canvas Drawing API, the Canvas Image API is very robust. With it, we can load in image data and apply it directly to the canvas. This image data can also be cut and spliced to display any desired portion. Furthermore, Canvas gives us the ability to store arrays of pixel data that we can manipulate and then draw back to the canvas.
There are two primary Canvas functions we can perform with images. We can display images, and we can modify them pixel by pixel and paint them back to the canvas. There are only a few Image API functions, but they open up a world of pixel-level manipulation that gives the developer the power to create optimized applications directly in the web browser without needing any plug-ins.
The Basic File Setup for This Chapter
All the examples in this chapter will use the same basic file setup
for displaying our demonstrations as we proceed through the Drawing API.
Use the following as the basis for all the examples we create—you will
only need to change the contents of the drawScreen() function:
<!doctype html>
<html lang="en">
<head>
<meta charset="UTF-8">
<title>Ch4BaseFile - Template For Chapter 4 Examples</title>
<script src="modernizr-1.6.min.js"></script>
<script type="text/javascript">
window.addEventListener('load', eventWindowLoaded, false);
function eventWindowLoaded() {

   canvasApp();

}

function canvasSupport () {
     return Modernizr.canvas;
}

function canvasApp(){

   if (!canvasSupport()) {
          return;
     }else{
      var theCanvas = document.getElementById("canvas");
      var context = theCanvas.getContext("2d");
   }

drawScreen();

   function drawScreen() {
      //make changes here
      context.fillStyle = '#aaaaaa';
      context.fillRect(0, 0, 200, 200);
      context.fillStyle = '#000000';
      context.font = '20px _sans';
      context.textBaseline = 'top';
      context.fillText  ("Canvas!", 0, 0);
  }
}
</script>
</head>
<body>
<div style="position: absolute; top: 50px; left: 50px;">
<canvas id="canvas" width="500" height="500">
 Your browser does not support HTML5 Canvas.
</canvas>
</div>
</body>
</html>
Image Basics
The Canvas API allows access to the DOM-defined Image object type through the use of the
drawImage() method. The image can be
defined in HTML, such as:
<img src="ship1.png" id="spaceship">
Or it can be defined in JavaScript. We create a new JavaScript
Image instance like this:
var spaceShip = new Image();
We can then set the file source of the image by assigning a URL to
the src attribute of our newly created
Image object:
spaceShip.src = "ship1.png";
Preloading Images
Before an image can be called in code, we must ensure that it has
properly loaded and is ready to be used. We do this by creating an event
listener to fire off when the load
event on the image occurs:
spaceShip.addEventListener('load', eventShipLoaded , false);When the image is fully loaded, the eventShipLoaded() function will fire off.
Inside this function we will then call drawScreen(), as we have in the previous
chapters:
function eventShipLoaded() {
   drawScreen();
}
Note
In practice, we would not create a separate event listener function for each loaded image. This code example works fine if your application contains only a single image. In Chapter 9, we will build a game with multiple image files (and sounds) and use a single listener function for all loaded resources.
Displaying an Image on the Canvas with drawImage()
Once we have an image loaded in, we can display it on the screen
in a number of ways. The drawImage()
Canvas method is used for displaying image data directly onto the
canvas. drawImage() is
overloaded and takes three separate sets of
parameters, each allowing varied manipulation of both the image’s source
pixels and the destination location for those pixels on the canvas.
Let’s first look at the most basic:
drawImage(Image, dx, dy)
This function takes in three parameters: an Image object, and x and y
values representing the top-left corner location to start painting the
image on the canvas.
Here is the code we would use to place our spaceship image at the 0,0 location (the top-left corner) of the canvas:
context.drawImage(spaceShip, 0, 0);
If we want to place another copy at 50,50, we would simply make the same call but change the location:
context.drawImage(spaceShip, 50, 50);
Example 4-1 shows the full code for what we have done so far.
var spaceShip = new Image();
spaceShip.addEventListener('load', eventShipLoaded , false);
spaceShip.src = "ship1.png";

function eventShipLoaded() {
   drawScreen();
}

function drawScreen() {

   context.drawImage(spaceShip, 0, 0);
   context.drawImage(spaceShip, 50, 50);

}
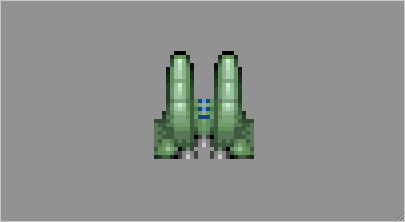
Figure 4-1 shows the 32×32 ship1.png file.
In practice, we would probably not put all of our drawing code
directly into a function such as drawScreen(). It almost always makes more
sense to create a separate function, such as placeShip(), shown here:
function drawScreen() {
   placeShip(context, spaceShip, 0, 0);
   placeShip(context, spaceShip, 50, 50);
}

function placeShip(ctx, obj, posX, posY, width, height) {
   if (width && height) {
     context.drawImage(obj, posX, posY, width, height);
   } else {
     context.drawImage(obj, posX, posY);
   }
}
The placeShip() function
accepts the context, the image object, the x and y
positions, and a height and width. If a height and width are passed in,
the first version of the drawScreen()
function is called. If not, the second version is called. We will look
at resizing images as they are drawn in the next section.
The ship1.png file we are using is a 32×32 pixel .png bitmap, which we have modified from Ari Feldman’s excellent SpriteLib. SpriteLib is a free library of pixel-based game sprites that Ari has made available for use in games and books. You can find the entire SpriteLib here: http://www.flyingyogi.com/fun/spritelib.html.
Note
The website for this book contains only the files necessary to complete the examples. We have modified Ari’s files to fit the needs of this book.
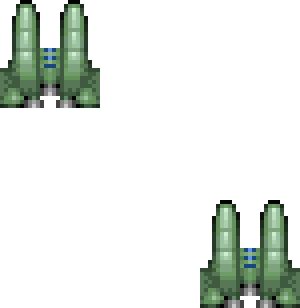
Figure 4-2 shows two copies of the image painted to the canvas. One of the copies has the top-left starting location of 0,0, and the other starts at 50,50.
Resizing an Image Painted to the Canvas
To paint and scale drawn images, we can also pass parameters into
the drawImage() function. For
example, this second version of drawImage() takes in an extra two parameters:
drawImage(Image, dx, dy, dw, dh)dw and dh
represent the width and height of the rectangle portion of the canvas
where our source image will be painted. If we only want to scale the
image to 64×64 or 16×16, we would use the following code:
context.drawImage(spaceShip, 0, 0,64,64);
context.drawImage(spaceShip, 0, 0,16,16);
Example 4-2 draws various sizes to the canvas.
function eventShipLoaded() {
   drawScreen();
}

function drawScreen() {

   context.drawImage(spaceShip, 0, 0);
   context.drawImage(spaceShip, 0, 34,32,32);
   context.drawImage(spaceShip, 0, 68,64,64);
   context.drawImage(spaceShip, 0, 140,16,16);
}
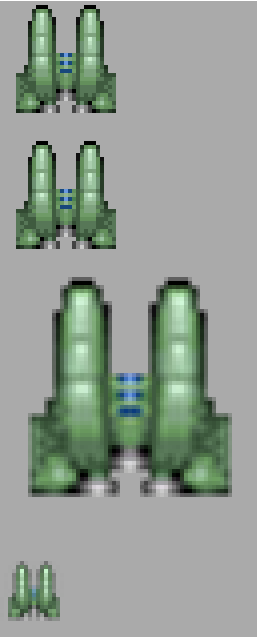
See Figure 4-3 for the output to this example.
In Example 4-2, we have added a gray box so we can better see the placement of the images on the canvas. The image we placed on the screen can scale in size as it is painted, saving us the calculation and steps necessary to use a matrix transformation on the object. The only caveat is that the scale origin point of reference is the top-left corner of the object. If we used a matrix operation, we could translate the origin point to the center of the object before applying the scale.
We have placed two 32×32 objects on the canvas to show that these two function calls are identical:
context.drawImage(spaceShip, 0, 0);
context.drawImage(spaceShip, 0, 34,32,32);
Aside from the fact that the second is placed 34 pixels below the first, the extra 32,32 at the end of the second call is unnecessary because it is the original size of the object. This demonstrates that the scale operation does not translate (or move) the object on any axis. The top-left corner of each is 0,0.
Copying Part of an Image to the Canvas
The third set of parameters that can be passed into drawImage() allows us to copy an arbitrary
rectangle of data from a source image and place it onto the canvas. This
image data can be resized as it is placed.
We are going to use a second source image for this set of operations: spaceships that have been laid out on what is called a tile sheet (also known as a sprite sheet, a texture sheet, or by many other names). This type of file layout refers to an image file that is broken up physically into rectangles of data. Usually these rectangles have an equal width and height. The “tiles” or “sprites” we will be using are 32 pixels wide by 32 pixels high, commonly referred to as 32×32 tiles.
Figure 4-4 shows a tile sheet with the grid lines turned on in the drawing application. These grid lines separate each of the tiles on the sheet.
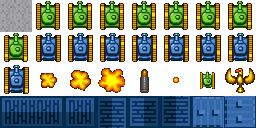
Figure 4-5 is the actual tile sheet—without grid lines—that we will use for our further examples.
The structure of the parameters for this third version of the
drawImage() function looks like
this:
drawImage(Image, sx, sy, sw, sh, dx, dy, dw, dh)sx and sy
represent the “source positions” to start copying the source image to
the canvas. sw and
sh represent the width and height of the
rectangle starting at sx and
sy. That rectangle will be copied to the
canvas at “destination” positions dx and
dy. As with the previous drawImage() function,
dw and dh
represent the newly scaled width and height for the image.
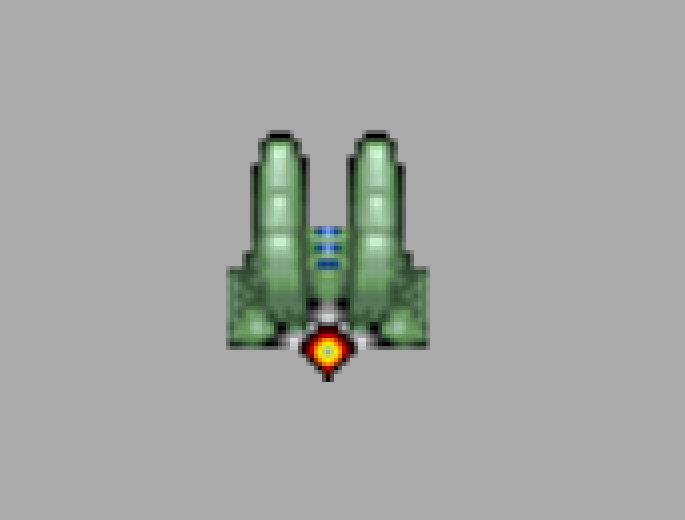
Example 4-3 copies the second version of our spaceship (tile number 2) to the canvas and positions it at 50,50. It also scales the image to 64×64, producing the result shown in Figure 4-6.
var tileSheet = new Image();
tileSheet.addEventListener('load', eventShipLoaded , false);

tileSheet.src = "ships.png";

function eventShipLoaded() {
   drawScreen();
}


function drawScreen() {
   //draw a background so we can see the Canvas edges
   context.fillStyle = "#aaaaaa";
   context.fillRect(0,0,500,500);
   context.drawImage(tileSheet, 32, 0,32,32,50,50,64,64);
}
As you can see, we have changed the name of our Image instance to tileSheet because it represents more than just
the source for the single ship image.
Now, let’s use this same concept to simulate animation using the tiles on our tile sheet.
Simple Cell-Based Sprite Animation
With a tile sheet of images, it is relatively simple to create what seems like cell-based or flip-book animation. This technique involves rapidly swapping images over time to simulate animation. The term flip-book comes from the age-old technique of drawing individual cells of animation in the top-left corner pages of a book. When the pages are rapidly flipped through, the changes are viewed over time, appearing to create a cartoon. Cell-based animation refers to a similar professional technique. Individual same-sized cells (or pages) of images are drawn to simulate animation. When played back rapidly with special devices in front of a camera, animated cartoons are recorded.
We can use the drawImage()
function and the first two tiles on our tile sheet to do the same
thing.
Creating an Animation Frame Counter
We can simulate the ship’s exhaust firing by rapidly flipping
between the first two tiles (or cells) on our tile sheet. To do this, we
set up a counter variable, which is how we track the tile we want to
paint to the canvas. We will use 0
for the first cell and 1 for the
second cell.
We will create a simple integer to count which frame we are displaying on our tile sheet:
var counter = 0;
Inside drawScreen(), we will
increment this value by 1 on each
frame. Since we only have two frames, we will need to set it back to
0 when it is greater than 1:
counter++;
if (counter >1) {
    counter = 0;
}
Or use the nice shortcut:
counter ^= 1;
Creating a Timer Loop
As it currently stands, our code will only be called a single
time. Let’s create a simple timer loop that will call the drawScreen() function 10 times a second, or
once every 100 milliseconds. A timer loop that is set to run at a
certain frame rate is sometimes referred to as a frame
tick or timer tick. Each tick is simply
a single iteration of the timer running all the code we put into our
drawScreen() function. We will also
need a function that starts the timer loop and initiates the tick once
the image has preloaded properly. We’ll name this function startUp():
function eventShipLoaded() {
   startUp();
}

function startUp(){
   setInterval(drawScreen, 100 );
}
Changing the Tile to Display
To change the tile to display, we can multiply the counter
variable by 32 (the tile width).
Since we only have a single row of tiles, we don’t have to change the
y value:
context.drawImage(tileSheet, 32*counter, 0,32,32,50,50,64,64);
Note
We will examine how to use a tile sheet consisting of multiple rows and columns in the next section, Advanced Cell-Based Animation.
Example 4-3 used this same line of code to draw our image. In Example 4-4, it will be placed on the canvas at 50,50 and scaled to 64×64 pixels. Let’s look at the entire set of code.
   var counter = 0;
   var tileSheet = new Image();
   tileSheet.addEventListener('load', eventShipLoaded , false);
   tileSheet.src = "ships.png";

   function eventShipLoaded() {
      startUp();
   }

   function drawScreen() {

       //draw a background so we can see the Canvas edges
       context.fillStyle = "#aaaaaa";
       context.fillRect(0,0,500,500);
       context.drawImage(tileSheet, 32*counter, 0,32,32,50,50,64,64);
         counter++;
         if (counter >1) {
            counter = 0;
         }
   }

    function startUp(){

        setInterval(drawScreen, 100 );
    }
When you run this code, you will see the exhaust on the ship turn off and on every 100 milliseconds, creating a simple cell-based animation.
Advanced Cell-Based Animation
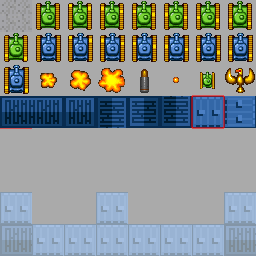
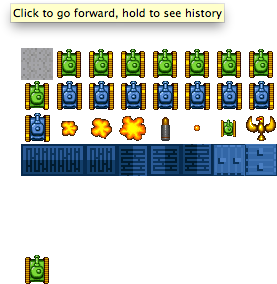
In the previous example, we simply flipped back and forth between two tiles on our tile sheet. Next, we are going to create a method that uses a tile sheet to play through a series of images. First, let’s look at the new tile sheet, created by using tiles from SpriteLib. Figure 4-7 shows the example sprite sheet, tanks_sheet.png; we will refer back to this figure throughout the chapter.
As you can see, it contains a number of 32×32 tiles that can be used in a game. We will not create an entire game in this chapter, but we will examine how to use these tiles to create a game screen. In Chapter 9, we will create a simple maze-chase game using some of these tiles.
Examining the Tile Sheet
The tile sheet is formatted into a series of tiles starting at the top left. As with a two-dimensional array, the numbering starts at 0—we call this 0 relative. Moving from left to right and down, each tile will be referenced by a single number index (as opposed to a multidimensional index). The gray square in the top left is tile 0, while the tank at the end of the first row (the rightmost tank) is tile 7. Moving down to the next row, the first tank on the far left of the second row is tile 8, and so on until the final tile on row 3 (the fourth row down when we start numbering at 0) is tile 31. We have four rows with eight columns each, making 32 tiles with indexes numbered 0 to 31.
Creating an Animation Array
Next, we are going to create an array to hold the tiles for the animation. There are two tanks on the tile sheet: one is green and one is blue. Tiles 1‒8 are a series that—when played in succession—will make it appear as though the green tank’s tracks are moving.
Note
Remember, the tile sheet starts at tile 0, but we want start with the first tank image at tile number 1.
We will store the tile ids we want to play for the tank in an array:
var animationFrames = [1,2,3,4,5,6,7,8];
We will use a counter to keep track of the current index of this array:
var frameIndex = 0;
Choosing the Tile to Display
We will use the frameIndex of
the animationFrames array to
calculate the 32×32 source rectangle from our tile sheet that we will
copy to the canvas. First, we need to find the x and y locations of the
top-left corner for the tile we want to copy. To do this, we will create
local variables in our drawScreen()
function on each iteration (frame) to calculate the position on the tile
sheet. The sourceX variable will
contain the top-left corner x
position, and the sourceY variable
will contain the top-left corner y
position.
Here is pseudocode for the sourceX calculation:
sourceX = integer(current_frame_index modulo
the_number_columns_in_the_tilesheet) * tile_width
The modulo (%) operator gives us the remainder of the division calculation. The actual code we will use for this calculation looks like this:
var sourceX = Math.floor(animationFrames[frameIndex] % 8) *32;
The calculation for the sourceY
value is similar, except we divide rather than use the modulo
operation:
sourceY = integer(current_frame_index divided by
the_number_columns_in_the_tilesheet) *tile_height
Here is the actual code we will use for this calculation:
var sourceY = Math.floor(animationFrames[frameIndex] / 8) *32;
Looping Through the Tiles
We will update the frameIndex
value on each frame tick. When frameIndex becomes greater than 7, we will set it back to 0:
frameIndex++;
     if (frameIndex == animationFrames.length) {
     frameIndex = 0;
     }
The animationFrames.length
value is 8. When the frameIndex is equal to 8, we must set it back to 0 to start reading the array values over
again, which creates an infinite animation loop.
Drawing the Tile
We will use drawImage() to
place the new tile on the screen on each iteration:
context.drawImage(tileSheet, sourceX, sourceY,32,32,50,50,32,32);
Here, we are passing the calculated sourceX and sourceY values into the drawImage() function. We then pass in the
width (32), the height (32), and the location (50,50) to draw the image on the canvas. Example 4-5 shows the full code.
var tileSheet = new Image();
tileSheet.addEventListener('load', eventShipLoaded , false);

tileSheet.src = "tanks_sheet.png";

var animationFrames = [1,2,3,4,5,6,7,8];
var frameIndex = 0;

function eventShipLoaded() {
  startUp();
}

function drawScreen() {

  //draw a background so we can see the Canvas edges
  context.fillStyle = "#aaaaaa";
  context.fillRect(0,0,500,500);

  var sourceX = Math.floor(animationFrames[frameIndex] % 8) *32;
  var sourceY = Math.floor(animationFrames[frameIndex] / 8) *32;

  context.drawImage(tileSheet, sourceX, sourceY,32,32,50,50,32,32);

  frameIndex++;
  if (frameIndex ==animationFrames.length) {
     frameIndex=0;
  }

}

function startUp(){

  setInterval(drawScreen, 100 );
}
When we run the example, we will see the eight tile cell frames for the tank run in order and then repeat—the only problem is that the tank isn’t going anywhere. Let’s solve that little dilemma next and drive the tank up the screen.
Moving the Image Across the Canvas
Now that we have the tank tracks animating, let’s “move” the tank. By animating the tank tracks and applying a simple movement vector to the tank’s position, we can achieve the simulation of animated movement.
To do this, we first need to create variables to hold the current
x and y positions of the tank. These represent the
top-left corner where the tile from our sheet will be drawn to the
canvas. In the previous examples, this number was set at 50 for each, so let’s use that value here as
well:
var x = 50;
var y = 50;
We also need a movement vector value for each axis. These are
commonly known as deltaX (dx) and deltaY (dy). They represent the “delta” or “change” in
the x or y axis position on each iteration. Our tank is
currently facing in the “up” position, so we will use -1 for the dy and 0
for the dx:
var dx = 0;
var dy = -1;
The result is that on each frame tick, our tank will move one pixel up on the y-axis and zero pixels on the x-axis.
Inside drawScreen() (which is
called on each frame tick), we will add the dx and dy
values to the x and y values, and then apply them to the drawImage() function:
y = y+dy;
x = x+dx;
context.drawImage(tileSheet, sourceX, sourceY,32,32,x,y,32,32);
Rather than use the hardcoded 50,50 for the location of the drawImage() call on the canvas, we have
replaced it with the current x,y
position. Let’s examine the entire code in Example 4-6.
var tileSheet = new Image();
tileSheet.addEventListener('load', eventShipLoaded , false);
tileSheet.src = "tanks_sheet.png";

var animationFrames = [1,2,3,4,5,6,7,8];
var frameIndex = 0;
var dx = 0;
var dy = -1;
var x = 50;
var y = 50;

function eventShipLoaded() {
  startUp();
}

function drawScreen() {

   y = y+dy;
   x = x+dx;

  //draw a background so we can see the Canvas edges
  context.fillStyle = "#aaaaaa";
  context.fillRect(0,0,500,500);

  var sourceX = Math.floor(animationFrames[frameIndex] % 8) *32;
  var sourceY = Math.floor(animationFrames[frameIndex] / 8) *32;

  context.drawImage(tileSheet, sourceX, sourceY,32,32,x,y,32,32);

  frameIndex++;
  if (frameIndex==animationFrames.length) {
     frameIndex=0;
  }

}

function startUp(){

  setInterval(drawScreen, 100 );
}
By running this example, we see the tank move slowly up the canvas while its tracks play through the eight separate tiles of animation.
Our tile sheet only has images of the tank facing in the up position. If we want to have the tank move in other directions, we can do one of two things. The first option is to create more tiles on the tile sheet to represent the left, right, and down positions. However, this method requires much more work and creates a larger source image for the tile sheet. We are going to solve this problem in another way, which we will examine next.
Applying Rotation Transformations to an Image
In the previous section, we created an animation using tiles from a tile sheet. In this section, we will take it one step further and use the Canvas transformation matrix to rotate our image before drawing it to the canvas. This will allow us to use only a single set of animated tiles for all four (or more) rotated directions in which we would like to display our images. Before we write the code, let’s examine what it will take to rotate our tank animation from the previous section.
Note
In Chapter 2, we dove into applying basic transformations when drawing with paths. The same concepts apply to transforming images on the canvas. If you have not read the section Simple Canvas Transformations in Chapter 2, you might want to review it before reading on.
Canvas Transformation Basics
Although we covered basic Canvas transformations in detail in Chapter 2, let’s review what’s necessary to transform an individual object on the canvas. Remember, the canvas is a single immediate-mode drawing surface, so any transformations we make are applied to the entire canvas. In our example, we are drawing two objects. First, we draw a gray background rectangle, and then we copy the current tile from our tile sheet to the desired location. These are two discrete objects, but once they are on the canvas, they are both simply collections of pixels painted on the surface. Unlike Flash or other platforms that allow many separate sprites or “movie clips” to occupy the physical space, there is only one such object on Canvas: the context.
To compensate for this, we create logical display objects. Both
the background and the tank are considered separate logical display
objects. If we want to draw the tank but rotate it with a transformation
matrix, we must separate the logical drawing operations by using the
save() and restore() Canvas context functions.
Let’s look at an example where we rotate the tank 90 degrees so it is facing to the right rather than up.
Step 1: Save the current context to the stack
The save() context function
will take the current contents of the canvas (in our case the gray
background rectangle) and store it away for “safekeeping”:
context.save();
Once we have transformed the tank, we will replace it with the
restore() function call.
Step 2: Reset the transformation matrix to identity
The next step in transforming an object is to clear the transformation matrix by passing it values that reset it to the identity values:
context.setTransform(1,0,0,1,0,0)
Step 3: Code the transform algorithm
Each transformation will be slightly different, but usually if
you are rotating an object, you will want to translate the matrix to
the center point of that object. Our tank will be positioned at 50,50
on the canvas, so we will translate it to 66,66. Since our tank is a
32×32 square tile, we simply add half of 32, or 16, to both the
x and y location points:
context.translate(x+16, y+16);
Next, we need to find the angle in radians for the direction we want the tank to be rotated. For this example, we will choose 90 degrees:
var rotation = 90;
var angleInRadians = rotation * Math.PI / 180;
context.rotate(angleInRadians);
Step 4: Draw the image
When we draw the image, we must remember that the drawing’s point of origin is no longer the 50,50 point from previous examples. Once the transformation matrix has been applied to translate to a new point, that point is now considered the 0,0 origin point for drawing.
This can be confusing at first, but it becomes clear with
practice. To draw our image with 50,50 as the top-left coordinate, we
must subtract 16 from the current position in both the x and y
directions:
context.drawImage(tileSheet, sourceX, sourceY,32,32,-16,-16,32,32);
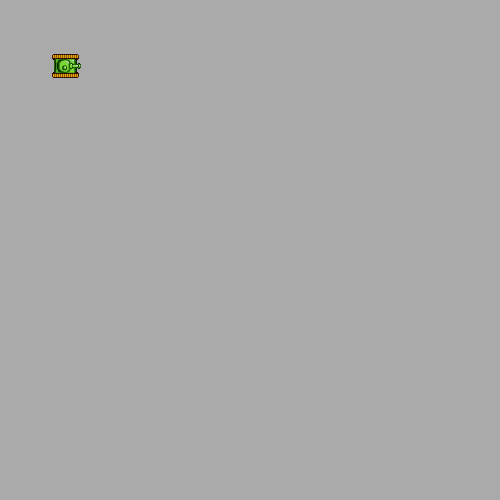
Example 4-7 adds in this rotation code to Example 4-4. When you run the example now, you will see the tank facing to the right.
Note
Notice in Example 4-7 that we remove the original
call to drawScreen() from the
previous examples, and replace it with a new event listener function
that is called after the tileSheet has been loaded. The new
function is called eventShipLoaded().
var tileSheet = new Image();
tileSheet.addEventListener('load', eventShipLoaded , false);

tileSheet.src = "tanks_sheet.png";

var animationFrames = [1,2,3,4,5,6,7,8];
var frameIndex = 0;
var rotation = 90;

var x = 50;
var y = 50;

function eventShipLoaded() {
   drawScreen();
}

function drawScreen() {

   //draw a background so we can see the Canvas edges
   context.fillStyle = "#aaaaaa";
   context.fillRect(0,0,500,500);

   context.save();
   context.setTransform(1,0,0,1,0,0)

   context.translate(x+16, y+16);
   var angleInRadians = rotation * Math.PI / 180;
   context.rotate(angleInRadians);

   var sourceX = Math.floor(animationFrames[frameIndex] % 8) *32;
   var sourceY = Math.floor(animationFrames[frameIndex] / 8) *32;

   context.drawImage(tileSheet, sourceX, sourceY,32,32,-16,-16,32,32);

   context.restore();

}

function eventShipLoaded() {
    drawScreen();
}
Figure 4-8 shows the output for this example.
Let’s take this one step further by applying the animation technique from Example 4-5 and looping through the eight tiles while facing the tank at the 90-degree angle.
Animating a Transformed Image
To apply a series of image tiles to the rotated context, we simply
have to add back in the frame tick loop code and increment the frameIndex variable on each frame tick. Example 4-8 has added this into the code for
Example 4-7.
var tileSheet = new Image();
tileSheet.addEventListener('load', eventShipLoaded , false);

tileSheet.src = "tanks_sheet.png";

var animationFrames = [1,2,3,4,5,6,7,8];
var frameIndex = 0;
var rotation = 90;
var x = 50;
var y = 50;

function eventShipLoaded() {
  startUp();
}

function drawScreen() {

  //draw a background so we can see the Canvas edges
  context.fillStyle = "#aaaaaa";
  context.fillRect(0,0,500,500);

  context.save();
  context.setTransform(1,0,0,1,0,0)
  var angleInRadians = rotation * Math.PI / 180;
  context.translate(x+16, y+16)
  context.rotate(angleInRadians);
  var sourceX = Math.floor(animationFrames[frameIndex] % 8) *32;
  var sourceY = Math.floor(animationFrames[frameIndex] / 8) *32;

  context.drawImage(tileSheet, sourceX, sourceY,32,32,-16,-16,32,32);
  context.restore();
  frameIndex++;
  if (frameIndex==animationFrames.length) {
      frameIndex=0;
  }

}

function startUp(){

  setInterval(drawScreen, 100 );
}
When you test Example 4-8, you should see that the tank has rotated 90 degrees, and the tank tracks loop through their animation frames.
As we did in Example 4-6,
let’s move the tank in the direction it is facing. This time, it will
move to the right until it goes off the screen. Example 4-9 has added back in
the dx and dy movement vectors; notice that dx is now 1, and dy
is now 0.
var tileSheet = new Image();
tileSheet.addEventListener('load', eventShipLoaded , false);

tileSheet.src = "tanks_sheet.png";

var animationFrames = [1,2,3,4,5,6,7,8];
var frameIndex = 0;
var rotation = 90;
var x = 50;
var y = 50;
var dx = 1;
var dy = 0;

function eventShipLoaded() {
  startUp();
}

function drawScreen() {
   x = x+dx;
   y = y+dy;

  //draw a background so we can see the Canvas edges
  context.fillStyle = "#aaaaaa";
  context.fillRect(0,0,500,500);

  context.save();
  context.setTransform(1,0,0,1,0,0)
  var angleInRadians = rotation * Math.PI / 180;
  context.translate(x+16, y+16)
  context.rotate(angleInRadians);
  var sourceX=Math.floor(animationFrames[frameIndex] % 8) *32;
  var sourceY=Math.floor(animationFrames[frameIndex] / 8) *32;

  context.drawImage(tileSheet, sourceX, sourceY,32,32,−16,−16,32,32);
  context.restore();

  frameIndex++;
  if (frameIndex ==animationFrames.length) {
     frameIndex=0;
  }

}

function startUp(){

  setInterval(drawScreen, 100 );
}
When Example 4-9 is running, you will see the tank move slowly across the screen to the right. Its tracks animate through the series of tiles from the tile sheet on a plain gray background.
So far, we have only used tiles to simulate sprite-based animated movement. In the next section, we will examine how to use an image tile sheet to create a much more elaborate background using a series of tiles.
Creating a Grid of Tiles
Many games use what is called a tile-based environment for backgrounds and level graphics. We are now going to apply the knowledge we have learned from animating an image on the canvas to create the background maze for our hypothetical game: No Tanks! We will use the same tile sheet from the previous tank examples, but instead of showing the tank sprite tiles, we will create a maze for the tank to move through. We will not actually cover the game-play portion of the code in this chapter because we want to focus on using images to render the screen. In Chapter 9 we will create a simple game using the type of examples shown here.
Defining a Tile Map
We will use the term tile map to refer to a game level or background built from a tile sheet. Take a look back at Figure 4-7—the four row by eight column tile sheet from earlier in this chapter. If we were to create a maze-chase game similar to Pac-Man, we could define the maze using tiles from a tile sheet. The sequence of tiles for our game maze would be considered a tile map.
The first tile is a gray square, which we can use for the “road” tiles between the wall tiles. Any tile that a game sprite can move on is referred to as walkable. Even though our tanks are not literally walking but driving, the concept is the same. In Chapter 9 we will create a small game using these concepts, but for now, let’s concentrate on defining a tile map and displaying it on the canvas.
Our tile map will be a two-dimensional array of tile id numbers. If you recall, the tile id numbers for our tile sheet are in a single dimension, numbering from 0 to 31. Let’s say we are going to create a very small game screen consisting of 10 tiles in length and 10 tiles in height. This means we need to define a tile map of 100 individual tiles (10×10). If our tiles are 32 pixels by 32 pixels, we will define a 320×320 game screen.
There are many ways to define a tile map. One simple way is to use a tile map editor program to lay out a grid of tiles, and then export the data to re-create the tile map in JavaScript. This is precisely how we are going to create our tile map.
Creating a Tile Map with Tiled
The program we are going to use, Tiled, is a great tile map editor that is available for Mac OS, Windows, and Linux. Of course, tile maps can be designed by hand, but map creation is much easier if we utilize a program such as Tiled to do some of the legwork for us. Tiled is available for free under the GNU free software license from http://www.mapeditor.org/.
Note
As stated before, you do not need to use this software. Tile maps can be created with other good (and free) software such as Mappy (http://tilemap.co.uk/mappy.php) and Tile Studio (http://tilestudio.sourceforge.net/), and even by hand using MS Paint.
The goal of creating a tile map is to visually lay out a grid of tiles that represents the game screen, and then export the tile ids that represent those tiles. We will use the exported data as a two-dimensional array in our code to build the tile map on the canvas.
Here are the basic steps for creating a simple tile map in Tiled for use in the following section:
Create a new tile map from the File menu. When it asks for Orientation, select Orthogonal with a Map Size of 10×10 and a Tile Size of 32×32.
From the Map menu, import the tanks_sheet.png to be used as the tile set. Select “New tileset” from this menu, and give it any name you want. Browse to find the tanks_sheet.png that you downloaded from this book’s website. Make sure that Tile Width and Tile Height are both 32; keep the Margin and Spacing both at 0.
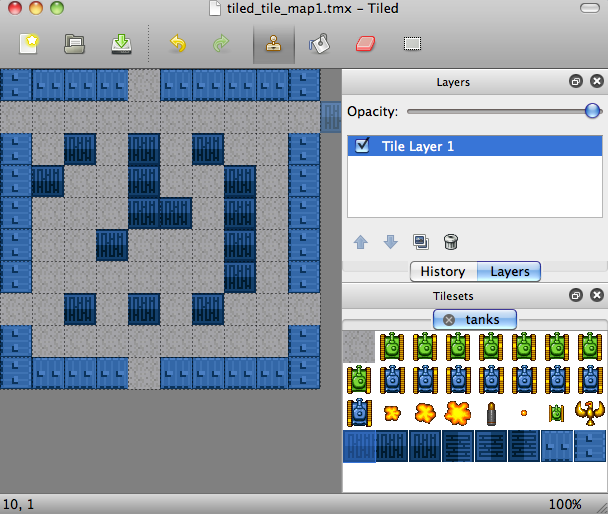
Select a tile from the tile set on the bottom-right side of the screen. Once selected, you can click and “paint” the tile by selecting a location on the tile map on the top- left side of the screen. Figure 4-9 shows the tile map created for this example.
Save the tile map. Tiled uses a plain text file format called .tmx. Normally, tile data in Tiled is saved out in a base-64-binary file format; however, we can change this by editing the preferences for Tiled. On a Mac, under the Tiled menu, there should be a Preferences section. (If you are using the software on Windows or Linux, you will find this in the File menu.) When setting the preferences, select CSV in the “Store tile layer data as” drop-down menu. Once you have done this, you can save the file from the File menu.
Here is a look at what the saved .tmx file will look like in a text editor:
<?xml version="1.0" encoding="UTF-8"?>
<map version="1.0" orientation="orthogonal" width="10" height="10"
        tilewidth="32" tileheight="32">
  <tileset firstgid="1" name="tanks" tilewidth="32" tileheight="32">
  <image source="tanks_sheet.png"/>
  </tileset>
  <layer name="Tile Layer 1" width="10" height="10">
  <data encoding="csv">
32,31,31,31,1,31,31,31,31,32,
1,1,1,1,1,1,1,1,1,1,
32,1,26,1,26,1,26,1,1,32,
32,26,1,1,26,1,1,26,1,32,
32,1,1,1,26,26,1,26,1,32,
32,1,1,26,1,1,1,26,1,32,
32,1,1,1,1,1,1,26,1,32,
1,1,26,1,26,1,26,1,1,1,
32,1,1,1,1,1,1,1,1,32,
32,31,31,31,1,31,31,31,31,32
</data>
</layer>
</map>The data is an XML data set used to load and save tile maps.
Because of the open nature of this format and the simple sets of row
data for the tile map, we can use this data easily in JavaScript. For
now, we are only concerned with the 10 rows of comma-delimited numbers inside the <data> node of the XML—we can take those
rows of data and create a very simple two-dimensional array to use in
our code.
Displaying the Map on the Canvas
The first thing to note about the data from Tiled is that it is 1 relative, not 0 relative. This means that the tiles are numbered from 1–32 instead of 0–31. We can compensate for this by subtracting one from each value as we transcribe it to our array, or programmatically during our tile sheet drawing operation. We will do it programmatically by creating an offset variable to be used during the draw operation:
var mapIndexOffset = -1;
Note
Rather than using the mapIndexOffset variable, we could loop
through the array of data and subtract 1 from each value. This would
be done before the game begins, saving the extra processor overload
from performing this math operation on each tile when it is
displayed.
Map height and width
We also are going to create two variables to give flexibility to our tile map display code. These might seem simple and unnecessary now, but if you get in the habit of using variables for the height and width of the tile map, it will be much easier to change its size in the future.
We will keep track of the width and height based on the number of rows in the map and the number of columns in each row:
var mapRows = 10;
var mapCols = 10;
Storing the map data
The data that was output from Tiled was a series of rows of numbers starting in the top left and moving left to right, then down when the rightmost column in a row was completed. We can use this data almost exactly as output by placing it in a two-dimensional array:
var tileMap = [
       [32,31,31,31,1,31,31,31,31,32]
   ,   [1,1,1,1,1,1,1,1,1,1]
   ,   [32,1,26,1,26,1,26,1,1,32]
   ,   [32,26,1,1,26,1,1,26,1,32]
   ,   [32,1,1,1,26,26,1,26,1,32]
   ,   [32,1,1,26,1,1,1,26,1,32]
   ,   [32,1,1,1,1,1,1,26,1,32]
   ,   [1,1,26,1,26,1,26,1,1,1]
   ,   [32,1,1,1,1,1,1,1,1,32]
   ,   [32,31,31,31,1,31,31,31,31,32]

   ];
Displaying the map on the canvas
When we display the tile map, we simply loop through the rows in
the tileMap array, and then loop
through the columns in each row. The tileID number at [row][column] will be the tile to copy from
the tile sheet to the canvas. row
*32 will be the y
location to place the tile on the canvas; col*32 will be the x location to place the tile:
Note
The row, column referencing might seem slightly confusing because row is the y direction and column is the x direction. We do this because our tiles are organized into a two-dimensional array. The row is always the first subscript when accessing a 2D array.
for (var rowCtr=0;rowCtr<mapRows;rowCtr++) {
   for (var colCtr=0;colCtr<mapCols;colCtr++){

      var tileId = tileMap[rowCtr][colCtr]+mapIndexOffset;
      var sourceX = Math.floor(tileId % 8) *32;
      var sourceY = Math.floor(tileId / 8) *32;

      context.drawImage(tileSheet, sourceX,
       sourceY,32,32,colCtr*32,rowCtr*32,32,32);
   }

}
We use the mapRows and the
mapCols variables to loop through
the data and to paint it to the canvas. This makes it relatively
simple to modify the height and width of the tile map without having
to find the hardcoded values in the code. We could have also done this
with other values such as the tile width and height, as well as the
number of tiles per row in the tile sheet (8).
The sourceX and sourceY values for the tile to copy are
found in the same way as in the previous examples. This time, though,
we find the tileId using the
[rowCtr][colCtr] two-dimensional
lookup, and then adding the mapIndexOffset. The offset is a negative
number (-1), so this effectively
subtracts 1 from each tile map value, resulting in 0-relative map values that are easier to
work with. Example 4-10
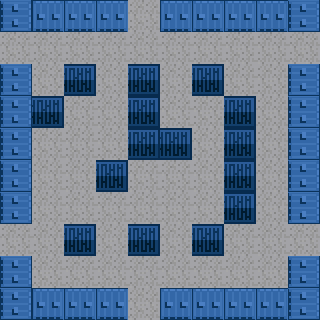
shows this concept in action, and Figure 4-10 illustrates the
results.
var tileSheet = new Image();
tileSheet.addEventListener('load', eventSheetLoaded , false);

tileSheet.src = "tanks_sheet.png";

var mapIndexOffset = -1;
var mapRows = 10;
var mapCols = 10;

var tileMap = [
       [32,31,31,31,1,31,31,31,31,32]
   ,   [1,1,1,1,1,1,1,1,1,1]
   ,   [32,1,26,1,26,1,26,1,1,32]
   ,   [32,26,1,1,26,1,1,26,1,32]
   ,   [32,1,1,1,26,26,1,26,1,32]
   ,   [32,1,1,26,1,1,1,26,1,32]
   ,   [32,1,1,1,1,1,1,26,1,32]
   ,   [1,1,26,1,26,1,26,1,1,1]
   ,   [32,1,1,1,1,1,1,1,1,32]
   ,   [32,31,31,31,1,31,31,31,31,32]

   ];

function eventSheetLoaded() {
   drawScreen()
}

function drawScreen() {
   for (var rowCtr=0;rowCtr<mapRows;rowCtr++) {
      for (var colCtr=0;colCtr<mapCols;colCtr++){

         var tileId = tileMap[rowCtr][colCtr]+mapIndexOffset;
         var sourceX = Math.floor(tileId % 8) *32;
         var sourceY = Math.floor(tileId / 8) *32;

         context.drawImage(tileSheet, sourceX,
         sourceY,32,32,colCtr*32,rowCtr*32,32,32);
      }

   }
}Next, we are going to leave the world of tile-based Canvas development (see Chapter 9 for an example of a small game developed with these principles). The final section of this chapter discusses building our own simple tile map editor. But before we get there, let’s look at panning around and zooming in and out of an image.
Zooming and Panning an Image
In this section, we will examine some methods to zoom and pan an image on the canvas. The image we are going to use is from a recent vacation to Central California. It is a large .jpg file, measuring 3648×2736. Obviously, this is far too large to view in a single canvas, so we will build a simple application allowing us to zoom and pan the image on our 500×500 canvas.
Figure 4-11 is a scaled-down version of this image.
Creating a Window for the Image
The first thing we are going to do is create a logical window, the size of the canvas, where our image will reside. We will use the following two variables to control the dimensions of this window:
var windowWidth = 500;
var windowHeight = 500;
We will also create two variables to define the current top-left corner for the window. When we move on to the panning examples, we will modify these values to redraw the image based on this location:
var windowX = 0;
var windowY = 0;
Drawing the Image Window
To draw the image window, we will simply modify the standard
context.drawImage() function call
using the values in the four variables we just defined:
context.drawImage(photo, windowX, windowY, windowWidth, windowHeight, 0, 0,
    windowWidth,windowHeight);
Let’s take a closer look at this for a refresher on how the
drawImage() function operates. The
values are passed in order:
photoThe image instance we are going to use as our source for painting onto the canvas
windowXThe top-left
xlocation to start copying from the source imagewindowYThe top-left
ylocation to start copying from the source imagewindowWidthThe width of the rectangle to start copying from the source image
windowHeightThe height of the rectangle to start copying from the source image
0The top-left
xdestination location for the image on the canvas0The top-left
ydestination location for the image on the canvaswindowWidthThe width in pixels for the destination copy (this can be modified to scale the image)
windowHeightThe height in pixels for the destination copy (this can be modified to scale the image)
When we draw from the image to the canvas, we will be modifying
the windowX and windowY values to create a panning effect.
Example 4-11 demonstrates
how to get the image onto the canvas with the window location set to
0,0. Figure 4-12 shows an example of the
output for Example 4-11.
var photo = new Image();
photo.addEventListener('load', eventPhotoLoaded , false);

photo.src = "butterfly.jpg";

var windowWidth = 500;
var windowHeight = 500;

var windowX = 0;
var windowY = 0;

function eventPhotoLoaded() {
   drawScreen()
}

function drawScreen(){
  context.drawImage(photo, windowX, windowY, windowWidth, windowHeight,
    0, 0, windowWidth,windowHeight);
}Panning the Image
To pan the window across the image, we simply need to modify the
windowX and windowY coordinates. In Example 4-12, we will modify the windowX coordinate inside a frame tick
interval. During each loop iteration, we will increase the value of
windowX by 10. We need to be careful not to go off the
far right side of the image, so we will subtract the windowWidth from the image.width, and use the result as the maximum
windowX position:
windowX+ = 10;
if (windowX>photo.width - windowWidth){
  windowX = photo.width - windowWidth;
}
Example 4-12 contains the changes necessary to perform this panning operation.
var photo = new Image();
photo.addEventListener('load', eventPhotoLoaded , false);

photo.src = "butterfly.jpg";

var windowWidth = 500;
var windowHeight = 500;

var windowX = 0;
var windowY = 0;

function eventPhotoLoaded() {
   startUp();
}

function drawScreen(){

   context.drawImage(photo, windowX, windowY, windowWidth, windowHeight,
       0,0,windowWidth,windowHeight);

   windowX += 10;
   if (windowX>photo.width - windowWidth){
       windowX = photo.width - windowWidth;
   }

}

function startUp(){

   setInterval(drawScreen, 100 );
}
When you test Example 4-12, you will see the window pan across the image and stop at the rightmost edge. Next, we will start to implement zooming into this simple example.
Zoom and Pan the Image
To zoom in or out of an image, we need to change the final
width and height values of the drawImage() function. Let’s examine how we
would zoom out to 50% of the original size of the image while panning at
the same time. The drawImage()
function will look like this:
context.drawImage(photo, windowX, windowY, windowWidth, windowHeight,
   0, 0, windowWidth*.5,windowHeight*.5);
Example 4-13 modifies Example 4-12 and adds in the 50% zoom.
var photo = new Image();
photo.addEventListener('load', eventPhotoLoaded , false);

photo.src = "butterfly.jpg";
var windowWidth = 500;
var windowHeight = 500;

var windowX = 0;
var windowY = 0;

function eventPhotoLoaded() {
   startUp();
}

function drawScreen(){

   context.drawImage(photo, windowX, windowY, windowWidth, windowHeight,
       0,0,windowWidth*.5,windowHeight*.5);

   windowX += 10;
   if (windowX>photo.width - windowWidth){
       windowX = photo.width - windowWidth;
   }

}

function startUp(){

   setInterval(drawScreen, 100 );
}
When we test this example, we will see that when zoomed out, the
image on the canvas is 50% of its original size. To zoom in, we simply
change the scale factor from .5 to a
number greater than 1:
context.drawImage(photo, windowX, windowY, windowWidth,windowHeight,
   0,0,windowWidth*2,windowHeight*2);
Example 4-14 changes this single line from Example 4-13 to zoom in rather than zoom out.
var photo = new Image();
photo.addEventListener('load', eventPhotoLoaded , false);

photo.src = "butterfly.jpg";

var windowWidth = 500;
var windowHeight = 500;

var windowX = 0;
var windowY = 0;


function eventPhotoLoaded() {
   startUp();
}

function drawScreen(){

   context.drawImage(photo, windowX, windowY, windowWidth, windowHeight,
       0,0,windowWidth*2,windowHeight*2);

   windowX += 10;
   if (windowX>photo.width - windowWidth){
       windowX = photo.width - windowWidth;
   }
}

function startUp(){

   setInterval(drawScreen, 100 );
}
Application: Controlled Pan and Zoom
Our final example for this section will be a simple application allowing the user to zoom and pan a photo.
The zoom scale
We are going to create a set of variables to handle the current zoom scale, the factor by which the zoom scale is increased or decreased, as well as the maximum and minimum zoom values:
var currentScale = .5;
var minScale = .2
var maxScale = 3;
var scaleIncrement = .1;
We will apply these values to the drawImage() function:
context.drawImage(photo, windowX, windowY, windowWidth, windowHeight,
    0,0,windowWidth*currentScale,windowHeight*currentScale);
Keyboard input
Now we need to create a keyboard listener function. The following function seems to work best in all browsers tested—it’s certainly not the only keyboard event listener, but it is tried and true throughout this book:
document.onkeydown = function(e){
   e = e?e:window.event;
}
Note
This function utilizes the ternary
operator. If the statement before the ? is true, the statement following the ? is executed. If it is false, the statement after the : is executed. This is a shorthand version
of the classic if/else construct.
We will add a switch/case statement, combining all the functions
we have put into the previous zoom and pan examples, along with a new
set of code for the y direction panning that we
have not implemented before. It is very similar to the
x direction panning: the left arrow key will pan
the image to the left; the right arrow key will pan the image to the
right:
case 38:
      //up
      windowY-=10;
      if (windowY<0){
         windowY = 0;
      }
      break;
case 40:
      //down
      windowY+=10;
      if (windowY>photo.height - windowHeight){
         windowY = photo.height - windowHeight;
      }
      break;
case 37:
      //left
      windowX-=10;
      if (windowX<0){
         windowX = 0;
      }
      break;
case 39:
       //right
      windowX+=10;
      if (windowX>photo.width - windowWidth){
         windowX = photo.width - windowWidth;
      }
      break;
We also need to add in two cases for the + and - keys to perform zoom in and zoom out actions:
case 109:
       //-
       currentScale-=scaleIncrement;
       if (currentScale<minScale){
          currentScale = minScale;
       }
       break;
case 107:
       //+
       currentScale+=scaleIncrement;
       if (currentScale>maxScale){
          currentScale = maxScale;
       }
When the user presses the + or - key, the currentScale variable is either incremented
or decremented by the scaleIncrement value. If the new value of
currentScale is greater than
maxScale or lower than minScale, we set it to maxScale or minScale, respectively.
Example 4-15 puts this entire application together. It doesn’t take many lines of code to create the simple interactions.
var photo = new Image();
photo.addEventListener('load', eventPhotoLoaded , false);

photo.src = "butterfly.jpg";

var windowWidth = 500;
var windowHeight = 500;

var windowX = 0;
var windowY = 0;
var currentScale = .5;
var minScale = .2
var maxScale = 3;
var scaleIncrement = .1;

function eventPhotoLoaded() {
   startUp();
}

function drawScreen(){

   //draw a background so we can see the Canvas edges
   context.fillStyle = "#ffffff";
   context.fillRect(0,0,500,500);

   context.drawImage(photo, windowX, windowY, windowWidth, windowHeight,
     0,0,windowWidth*currentScale,windowHeight*currentScale);

}

function startUp(){

   setInterval(drawScreen, 100 );
}

document.onkeydown = function(e){

   e = e?e:window.event;
   console.log(e.keyCode + "down");

   switch (e.keyCode){
      case 38:
            //up
            windowY-=10;
            if (windowY<0){
               windowY = 0;
            }
            break;
      case 40:
            //down
            windowY+=10;
            if (windowY>photo.height - windowHeight){
               windowY = photo.height - windowHeight;
            }
            break;
      case 37:
            //left
            windowX-=10;
            if (windowX<0){
               windowX = 0;
            }
            break;
      case 39:
            //right
            windowX+=10;
            if (windowX>photo.width - windowWidth){
               windowX = photo.width - windowWidth;
            }
            break;
      case 109:
            //-
            currentScale-=scaleIncrement;
            if (currentScale<minScale){
               currentScale = minScale;
            }
            break;
      case 107:
            //+
            currentScale+=scaleIncrement;
            if (currentScale>maxScale){
               currentScale = maxScale;
         }
   }

}
When testing Example 4-15, use the arrow keys to pan across the photo, and the + and - keys to zoom in and out.
Pixel Manipulation
In this section, we will first examine the Canvas Pixel Manipulation API, and then build a simple application demonstrating how to manipulate pixels on the canvas in real time.
The Canvas Pixel Manipulation API
The Canvas Pixel Manipulation API gives us the ability to “get,”
“put,” and “change” individual pixels utilizing what is known as the
CanvasPixelArray interface. ImageData is the base object type for this
manipulation, and an instance of this object is created with the
createImageData() function call.
Let’s start there.
The createImageData() function
sets aside a portion of memory to store individual pixels’ worth of data
based on the following three constructors:
imagedata = context.createImageData(sw, sh)The
swandshparameters represent thewidthandheightvalues for theImageDataobject. For example,imagedata=createImageData(100,100)would create a 100×100 area of memory in which to store pixel data.imagedata = context.createImageData(imagedata)The
imagedataparameter represents a separate instance ofImageData. This constructor creates a newImageDataobject with the same width and height as the parameterImageData.imagedata = context.createImageData()This constructor returns a blank
ImageDatainstance.
ImageData attributes
An ImageData object contains
three attributes:
ImageData.heightThis returns the height in pixels of the
ImageDatainstance.ImageData.widthThis returns the width in pixels of the
ImageDatainstance.ImageData.dataThis returns a single dimensional array of pixels representing the image data. Image data is stored with 32-bit color information for each pixel, meaning that every fourth number in this data array starts a new pixel. The four elements in the array represent the red, green, blue, and alpha transparency values of a single pixel.
Getting image data
To retrieve a set of pixel data from the canvas and put it into
an ImageData instance, we use the
getImageData() function
call:
imagedata=context.getImageData(sx,sy,sw,sh)
sx, sy,
sw, and sh
define the location and size of the source rectangle to copy from the
canvas to the ImageData
instance.
Note
A security error will be thrown if the origin domain of an image file is not the same as the origin domain of the web page. This affects local files (when running on your hard drive rather than on a web server running locally or on a remote server), as most browsers will treat local image files as though they are from a different domain than the web page. When running on a web server, this error will not be thrown with local files. The current version of Safari (5.02) does not throw this error for local files.
Putting image data
To copy the pixels from an ImageData instance to the canvas, we use the
putImageData() function call. There
are two different constructors for this call:
context.putImageData (imagedata,dx,dy)context.putImageData (imagedata,dx,dy[,dirtyX,dirtyY,dirtyWidth,dirtyHeight])
The first constructor simply paints the entire ImageData instance to the destinationX (dx) and destinationY (dy) locations. The second constructor does
the same, but allows the passage of a “dirty rectangle,” which
represents the area of the ImageData to paint to the canvas.
Application Tile Stamper
We are going to create a simple application that will allow the
user to highlight a box around some pixels on an image, copy them, and
then use them as a stamp to paint back to the canvas. It will not be a
full-blown editing application by any means—it’s just a demonstration of
one use of the ImageData
object.
Note
This application will need to be run from a local or remote web
server, as most browsers will throw an exception if an application
attempts to call getImageData() on
a file—even in the same folder on a local machine. The current version
of Safari (5.02) does not throw this error.
To create this simple application, we will use the tile sheet from earlier in this chapter. The user will click on a spot on the tile sheet, highlighting a 32×32 square tile. That tile can then be painted onto the bottom section of the canvas. To demonstrate pixel manipulation, we will set the color of the pixels to a new alpha value before they are painted to the screen. This will be the humble beginning to making our own tile map editor.
Once again, we will use the tanks_sheet.png file from Figure 4-7.
How ImageData.data is organized
The ImageData.data attribute
is a single-dimensional array containing four bytes for every pixel in
the ImageData object. We will be
using 32×32 tiles in our example application. A 32×32 tile contains
1,024 pixels (or 1K of data). The ImageData.data attribute for an ImageData instance that holds a 32×32 image
would be 4,096 bytes (or 4K). This is because a separate byte is used
to store each of the red, green, blue, and alpha values for each
pixel. In our application, we will loop through each pixel and set its
alpha value to 128. Here is the
code we will use:
for (j=3; j< imageData.data.length; j+=4){
   imageData.data[j] = 128;
}
We start our loop at 3, which
is the fourth attribute in the array. The single-dimensional array
contains a continuous set of values for each pixel, so index 3 represents the alpha value for the first
pixel (because the array is 0 relative). Our loop then skips to every
fourth value in the array and sets it to 128. Once the loop is complete, all pixels
will have an alpha value of 128.
Note
As opposed to other Canvas alpha manipulations where the alpha value is between 0 and 1, the alpha value is between 0 and 255 when manipulating it via the pixel color values.
A visual look at our basic application
Figure 4-13 is a screenshot of the simple Tile Stamper application we will create.
Note
Figure 4-13 is running in Safari 5.1 locally. As of this writing, this is the only browser that does not throw an exception when trying to manipulate the pixel data of a locally loaded file when not run on a web server.
The screen is broken up into two sections vertically. The top
section is the 256×128 tile sheet; the bottom is a tile map of the
same size. The user will select a tile in the top section, and it will
be highlighted by a red square. The user can then stamp the selected
tile to the tile map drawing area in the lower portion. When a tile is
drawn in this lower portion, we will set its alpha value to 128.
Adding mouse events to the canvas
We need to code our application to respond to mouse clicks and
to keep track of the current x and
y positions of the mouse pointer.
We will set up two global application scope variables to store the
mouse pointer’s current position:
var mouseX;
var mouseY;
We will also set up two event listener functions and attach them
to the theCanvas object:
theCanvas.addEventListener("mousemove", onMouseMove, false);
theCanvas.addEventListener("click", onMouseClick, false);
In the HTML, we will set up a single Canvas object:
<canvas id="canvas" width="256" height="256"  style="position: absolute;
    top: 50px; left: 50px;">
 Your browser does not support HTML5 Canvas.
</canvas>
In the JavaScript portion of our code, we will define the canvas:
theCanvas = document.getElementById("canvas");Notice that we set the <canvas> position to top: 50px and left:
50px. This will keep the application from being shoved up
into the top-left corner of the browser, but it also gives us a chance
to demonstrate how to find correct mouse x and y
values when the <canvas> tag
is not in the top-left corner of the page. The onMouseMove function will make use of this
information to offset the mouseX
and mouseY values based on the
position of the <canvas>
tag:
function onMouseMove(e) {
   mouseX = e.clientX-theCanvas.offsetLeft;
   mouseY = e.clientY-theCanvas.offsetTop;
}
The onMouseClick function
will actually do quite a lot in our application. When the mouse button
is clicked, this function will determine whether the user clicked on
the tile sheet or on the tile map drawing area below it. If the user
clicked on the tile sheet, the function will determine which exact
tile was clicked. It will then call the highlightTile() function and pass in the id
(0–31) of the tile clicked, along with the x and y
locations for the top-left corner of the tile.
If the user clicked in the lower portion of the tile map drawing area, this function will again determine which tile the user clicked on, and stamp the current selected tile in that location on the tile map. Here is the function:
function onMouseClick(e) {

   if (mouseY < 128){
      //find tile to highlight
      var col = Math.floor(mouseX / 32);
      var row = Math.floor(mouseY / 32);
      var tileId = (row*7)+(col+row);
      highlightTile(tileId,col*32,row*32)
   }else{
      var col = Math.floor(mouseX / 32);
      var row = Math.floor(mouseY / 32);
      context.putImageData(imageData,col*32,row*32);
      }
   }
Let’s take a closer look at the tile sheet click (mouseY < 128).
To determine the tileId of
the tile clicked on the tile sheet, we first need to convert the
x location of the mouse click to a
number from 0‒7, and the y location
to a number from 0‒3. We do this by calling the Math.floor function on the result of the
current mouseX or mouseY location, divided by the tile width
or height (they are both 32). This
will find the row and col of the clicked tile:
var col = Math.floor(mouseX / 32);
var row = Math.floor(mouseY / 32)
To find the tileId (the 0‒31
tile number of the tile sheet) of this row and column combination, we
need to use the following calculation:
TileId = (row*totalRows-1) + (col+row);
The actual calculation, with values for our application, looks like this:
var tileId = (row*7)+(col+row);
For example, if the user clicks on the point where mouseX = 50 and mouseY = 15, the calculation would work like
this:
col = Math.floor(50/32);    // col = 1
row = Math.floor(15/32);    // row = 0
tileId = (0*7)+(1+0);       // tileId = 1
This position is the second tile on the tile sheet. The onMouseClick() function then passes the
tileId and col value multiplied by 32, and the row value multiplied by 32, into the highlightTile() function. This tells the
highlightTile() function the exact
tileId, row, and col the user clicked.
If the user clicked the tile map drawing area in the lower
portion of the screen, the code does the same row and column
calculation. However, it then calls the putImageData() function and passes in the
ImageData instance that holds the
tile to stamp and the top-left location to place the tile:
var col = Math.floor(mouseX / 32);
var row = Math.floor(mouseY / 32);
context.putImageData(imageData,col*32,row*32);
The highlightTile() function
The highlightTile() function
accepts three parameters:
The 0–31
tileIdof the tile on the tile sheetThe top-left
xcoordinate of the tile represented by thetileIdThe top-left
ycoordinate of the tile represented by thetileId
Note
The x and y coordinates can be found by passing in
the tileId value, but they are
needed in the onMouseDown
function, so we pass them in from there when calling highlightTile(). This way, we do not need
to perform the calculation twice.
The first task highlightTile() tackles is redrawing the
tile sheet at the top of the screen:
context.fillStyle = "#aaaaaa";
context.fillRect(0,0,256,128);
drawTileSheet();
It does this to delete the red box around the current tile,
while preparing to draw a new red box around the tile represented by
the tileId passed in.
The drawTileSheet() function
then paints the tanks_sheet.png
file to the canvas starting at
0,0:
function drawTileSheet(){
   context.drawImage(tileSheet, 0, 0);
}
Next, the highlightTile()
function copies the new pixel data (with no red line around it yet)
from the canvas and places it in the ImageData instance:
ImageData = context.getImageData(x,y,32,32);
The ImageData variable now
contains a copy of the pixel data for the tile from the canvas. We
then loop through the pixels in ImageData.data (as described previously in
How ImageData.data is organized), and set the alpha
value of each to 128.
Finally, now that the ImageData variable contains the correct
pixels with the altered alpha values, we can draw the red line around
the tile that’s been selected to stamp on the tile map:
var startX = Math.floor(tileId % 8) *32;
var startY = Math.floor(tileId / 8) *32;
context.strokeStyle = "red";
context.strokeRect(startX,startY,32,32)
Example 4-16 is the entire set of code for this application.
<!doctype html>
<html lang="en">
<head>
<meta charset="UTF-8">
<title>CH4EX16: Tile Stamper Application</title>
<script src="modernizr-1.6.min.js"></script>
<script type="text/javascript">
window.addEventListener('load', eventWindowLoaded, false);
function eventWindowLoaded() {

   canvasApp();

}

function canvasSupport () {
  return Modernizr.canvas;
}

function canvasApp(){

   if (!canvasSupport()) {
          return;
   }else{
      var theCanvas = document.getElementById("canvas");
      var context = theCanvas.getContext("2d");
   }

   var mouseX;
   var mouseY;

   var tileSheet = new Image();
   tileSheet.addEventListener('load', eventSheetLoaded , false);
   tileSheet.src = "tanks_sheet.png";

   var imageData = context.createImageData(32,32);

   function eventSheetLoaded() {
      startUp();
   }

   function startUp(){
      context.fillStyle = "#aaaaaa";
      context.fillRect(0,0,256,256);
      drawTileSheet();
   }

   function drawTileSheet(){
      context.drawImage(tileSheet, 0, 0);

   }

   function highlightTile(tileId,x,y){
      context.fillStyle = "#aaaaaa";
      context.fillRect(0,0,256,128);
      drawTileSheet();

      imageData = context.getImageData(x,y,32,32);
      //loop through imageData.data. Set every 4th value to a new value
      for (j=3; j< imageData.data.length; j+=4){
         imageData.data[j]=128;
      }

      var startX = Math.floor(tileId % 8) *32;
      var startY = Math.floor(tileId / 8) *32;
      context.strokeStyle = "red";
      context.strokeRect(startX,startY,32,32)
   }

   function onMouseMove(e) {
      mouseX = e.clientX-theCanvas.offsetLeft;
      mouseY = e.clientY-theCanvas.offsetTop;

   }

   function onMouseClick(e) {
      console.log("click: " + mouseX + "," + mouseY);
      if (mouseY < 128){
         //find tile to highlight
         var col = Math.floor(mouseX / 32);
         var row = Math.floor(mouseY / 32)
         var tileId = (row*7)+(col+row);
         highlightTile(tileId,col*32,row*32)
      }else{
         var col = Math.floor(mouseX / 32);
         var row = Math.floor(mouseY / 32);

         context.putImageData(imageData,col*32,row*32);


      }
   }

   theCanvas.addEventListener("mousemove", onMouseMove, false);
   theCanvas.addEventListener("click", onMouseClick, false);

}

</script>
</head>
<body>
<div>
<canvas id="canvas" width="256" height="256"  style="position: absolute;
    top: 50px; left: 50px;">
 Your browser does not support HTML5 Canvas.
</canvas>
</div>
</body>
</html>Copying from One Canvas to Another
The canvas allows us to use another canvas as the source of a bitmap drawing operation. Let’s take a quick look at how we might utilize this functionality.
We will need to modify the base file for this chapter and create an
extra <canvas> tag in our HTML.
We will name this extra <canvas>
element canvas2 (it can be given any id
as long as it is not the same id as the first <canvas>). Here is what our HTML <body> will look like now:
<body>
<div>
<canvas id="canvas" width="256" height="256"  style="position: absolute;
    top: 50px; left: 50px;">Your browser does not support HTML5 Canvas.</canvas>
<canvas id="canvas2" width="32" height="32"  style="position: absolute;
    top: 256px; left: 50px;">Your browser does not support HTML5 Canvas.</canvas>
</div>
</body>
We will place the second <canvas> below the original, and give it a
width and height of 32.
We will also need to create a new context and internal reference variable
for canvas2. Here is the code that will
be used to provide a reference to both <canvas> elements:
if (!canvasSupport()) {
     return;

  }else{

   var theCanvas = document.getElementById("canvas");
   var context = theCanvas.getContext("2d");
   var theCanvas2 = document.getElementById("canvas2");
   var context2 = theCanvas2.getContext("2d");

}
Example 4-17 will use the tile sheet image from earlier examples and draw it to the first canvas. It will then copy a 32×32 square from this canvas and place it on the second canvas.
<!doctype html>
<html lang="en">
<head>
<meta charset="UTF-8">
<title>CH4EX17: Canvas Copy</title>
<script src="modernizr-1.6.min.js"></script>
<script type="text/javascript">
window.addEventListener('load', eventWindowLoaded, false);
function eventWindowLoaded() {

   canvasApp();

}

function canvasSupport () {

     return Modernizr.canvas;

}

function canvasApp(){
   if (!canvasSupport()) {
      return;
   }else{
      var theCanvas = document.getElementById("canvas");
      var context = theCanvas.getContext("2d");
      var theCanvas2 = document.getElementById("canvas2");
      var context2 = theCanvas2.getContext("2d");
   }

   var tileSheet = new Image();
   tileSheet.addEventListener('load', eventSheetLoaded , false);
   tileSheet.src="tanks_sheet.png";


   function eventSheetLoaded() {

      startUp();
   }

   function startUp(){
      context.drawImage(tileSheet, 0, 0);
      context2.drawImage(theCanvas, 32, 0,32,32,0,0,32,32);
   }
}
</script>
</head>
<body>
<div>
<canvas id="canvas" width="256" height="256"  style="position: absolute;
    top: 50px; left: 50px;"> Your browser does not support HTML5 Canvas.</canvas>

<canvas id="canvas2" width="32" height="32"  style="position: absolute;
    top: 256px; left: 50px;">Your browser does not support HTML5 Canvas.</canvas>

</div>
</body>
</html>
Figure 4-14 shows the canvas copy functions in operation.
Canvas copy operations can be very useful when creating applications
that need to share and copy image data across multiple <div> instances on (and the Canvas object within) a web page. For example,
multiple Canvas elements can be spread
across a web page, and as the user makes changes to one, the others can be
updated. This can be used for fun applications, such as a “minimap” in a
game, or even in serious applications, such as stock portfolio charting
and personalization features.
What’s Next
We covered quite a lot in this chapter, evolving from simply loading
images to animating and rotating them. We looked at using tile sheets and
tile maps, and then we built some useful applications with Canvas image
functions and capabilities. In the first four chapters, we covered most of
what Canvas offers as a drawing surface. In the next six chapters, we will
cover some more advanced topics, such as applying 2D physics to Canvas objects, integrating the HTML5 <video> and <audio> tags with the <canvas> tag, creating games, and looking
at some libraries and features that we can use to extend the functionality
of HTML5 Canvas, even creating applications for mobile devices.
Get HTML5 Canvas now with the O’Reilly learning platform.
O’Reilly members experience books, live events, courses curated by job role, and more from O’Reilly and nearly 200 top publishers.
