Before and after graphs for filled blank interval support
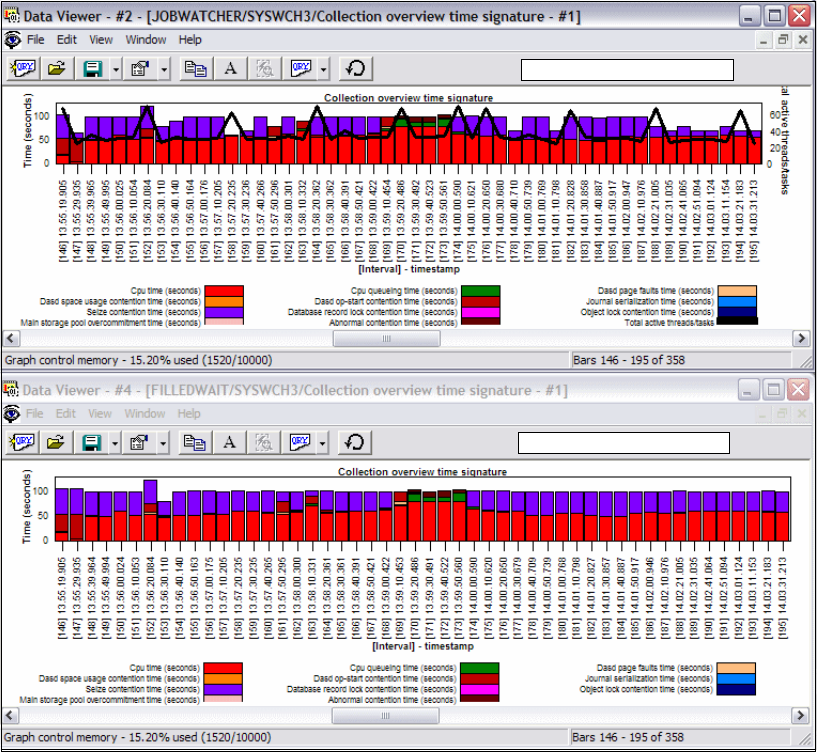
We compare the Collection overview time signature graphs in Figure E-7.
The graph at the top of the figure shows the collection-wide wait profile for our data when
the CRTWCHSUM command has not yet been run.
The graph at the bottom of the figure shows the collection-wide wait profile for the same
data after the CRTWCHSUM command has been run.
Figure E-7 Filled blank waits comparison: Collection overview time signature
Notice that the seize wait time in intervals such as 147, 158, 159, and 161 is now correctly
represented in the lower graph. ...
Become an O’Reilly member and get unlimited access to this title plus top books and audiobooks from O’Reilly and nearly 200 top publishers, thousands of courses curated by job role, 150+ live events each month, and much more.
O’Reilly covers everything we've got, with content to help us build a world-class technology community, upgrade the capabilities and competencies of our teams, and improve overall team performance as well as their engagement.
Julian F.
Head of Cybersecurity
I wanted to learn C and C++, but it didn't click for me until I picked up an O'Reilly book. When I went on the O’Reilly platform, I was astonished to find all the books there, plus live events and sandboxes so you could play around with the technology.
Addison B.
Field Engineer
I’ve been on the O’Reilly platform for more than eight years. I use a couple of learning platforms, but I'm on O'Reilly more than anybody else. When you're there, you start learning. I'm never disappointed.
Amir M.
Data Platform Tech Lead
I'm always learning. So when I got on to O'Reilly, I was like a kid in a candy store. There are playlists. There are answers. There's on-demand training. It's worth its weight in gold, in terms of what it allows me to do.