Chapter 4. Administration
This chapter explains how to get more details about the Kubernetes cluster. It introduces the Kubernetes dashboard and basic CLI commands, discusses application logs and other means of debugging the application, and covers monitoring an application’s performance using add-on components of Heapster, InfluxDB, and Grafana.
The Kubernetes administration guide provides a comprehensive set of docs on Kubernetes administration.
Cluster Details
Once the cluster is up and running, often you’ll want to get more details about it. You can obtain these details using kubectl. In addition, you can use the Kubernetes dashboard, a general-purpose, web-based UI, to view this information as well. It can be used to manage the cluster and applications running in the cluster.
The dashboard is accessible at the URI http://<kubernetes-master>/ui. This URI is redirected to this URI:
- http://<kubernetes-master>:8443/api/v1/proxy/namespaces/kube-system/services/kubernetes-dashboard
It provides an overview of applications running in the cluster, different Kubernetes resources, and details about the cluster itself.
The dashboard is not enabled by default and so must be explicitly enabled. Installing Kubernetes Addons explains how to enable the dashboard for a cluster installed using Kops. “Running Kubernetes Locally via Minikube” explains how to enable the dashboard for a cluster started using Minikube.
Figure 4-1 shows a view of dashboard with a Couchbase cluster and a WildFly replication controller.
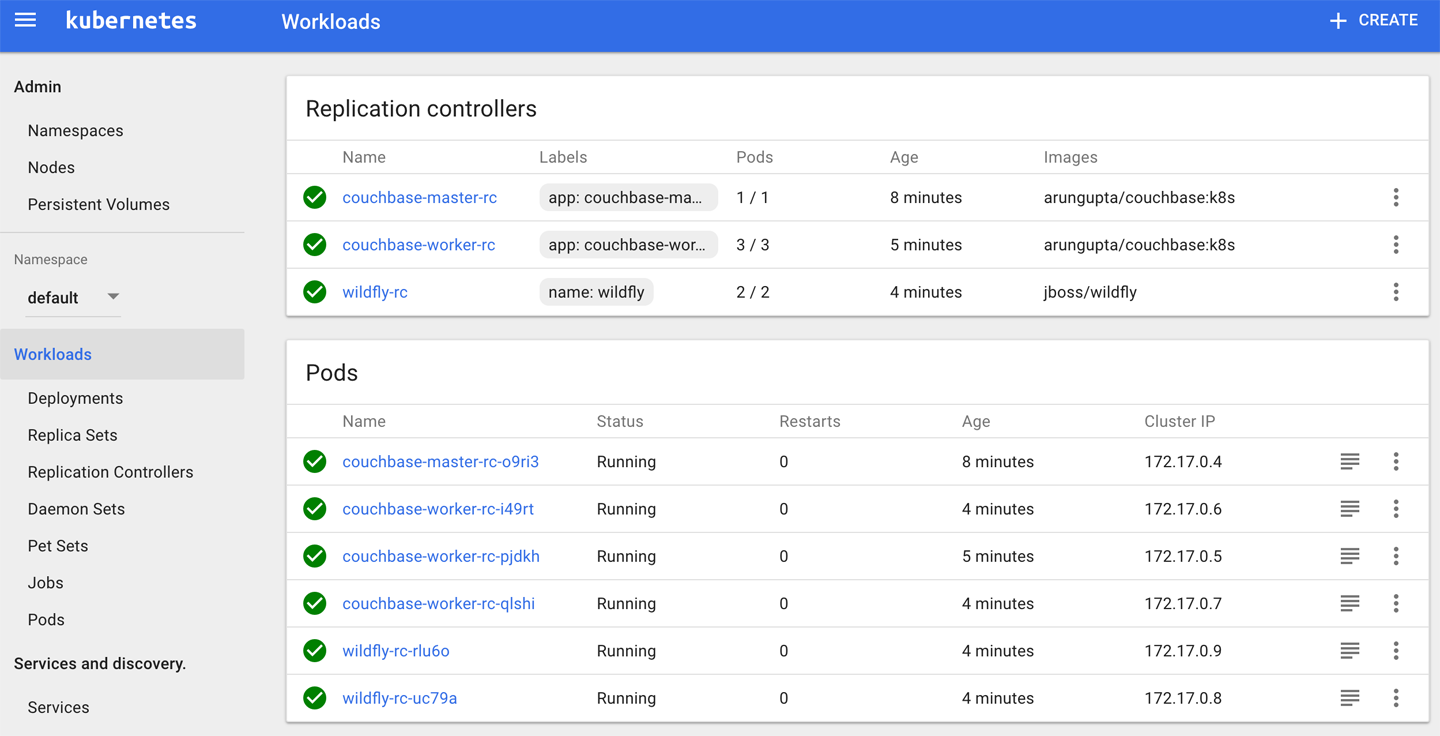
Figure 4-1. Kubernetes dashboard
It shows all the nodes and namespaces in the cluster. Once you choose a namespace, you’ll see different resources within that namespace, such as deployments, replica sets, replication controllers, and daemon sets. You can create and manage each resource by uploading the resource configuration file.
The information in the dashboard is also accessible via the kubectl commands.
The kubectl cluster-info command displays the addresses of the master and services with the label kubernetes.io/cluster-service=true. The output from the Minikube install is shown in Example 4-1.
Example 4-1. Kubectl cluster-info output
Kubernetes master is running at https://192.168.99.100:8443
KubeDNS is running at https://192.168.99.100:8443/api/. . ./
    kube-dns
    kubernetes-dashboard is running at https://192.168.99.100:8443/
    api/. . ./kubernetes-dashboard

To further debug and diagnose cluster problems, use 'kubectl
    cluster-info dump'.
The output shows the URI of the master, the DNS service, and the dashboard.
Example 4-2 shows similar output from a Kubernetes cluster running on AWS.
Example 4-2. Kubectl cluster-info output from AWS
Kubernetes master is running at https://api.kubernetes.arungupta.me
KubeDNS is running at https://api.kubernetes.arungupta.me/api/.../
    kube-dns

To further debug and diagnose cluster problems, use 'kubectl
    cluster-info dump'.
This output does not have the dashboard URL because that component has not been installed yet.
As the output states, complete details about the cluster can be obtained with the kubectl cluster-info dump command.
More details about the client (i.e., kubectl CLI) and the server (i.e., Kubernetes API server) can be obtained with the kubectl version command. The output looks like the following:
Client Version: version.Info{Major:"1", Minor:"6", GitVersion:
    "v1.6.2", GitCommit:"477efc3cbe6a7effca06bd1452fa356e2201e
    1ee", GitTreeState:"clean", BuildDate:"2017-04-19T20:33:11
    Z", GoVersion:"go1.7.5", Compiler:"gc", Platform:"darwin/
    amd64"}
Server Version: version.Info{Major:"1", Minor:"6", GitVersion:
    "v1.6.0", GitCommit:"fff5156092b56e6bd60fff75aad4dc9de6b6ef
    37", GitTreeState:"dirty", BuildDate:"2017-04-07T20:46:46Z",
    GoVersion:"go1.7.3", Compiler:"gc", Platform:"linux/amd64"}
The output prints two lines, one each for the client and server. The value of the Major and Minor attributes defines the Kubernetes API server used by each one. Both use version 1.4 in our case. Other detailed information about the binary requesting and serving the Kubernetes API is displayed as well.
The kubectl get nodes command provides basic information—name, status, and age—about each node in the cluster. kubectl describe nodes provides detailed information about each node in the cluster. This include pods running on a node; CPU and memory requests and limits for each pod; labels, events, and conditions for each node in the cluster.
The kubectl top command displays resource consumption for nodes or pods. For nodes, it shows how many cores and memory are allocated to each node. It shows percent utilization for both of them as well.
Application Logs
Accessing application logs is typically the first step to debugging any errors. These logs provide valuable information about what might have gone wrong. Kubernetes provides integrated support for logging during development and production.
The kubectl logs command prints standard output and standard error output from the container(s) in a pod. If there is only one container in the pod, the container name is optional. If the pod consists of multiple containers, the container name must be specified—for example, kubectl logs <pod-name> <container-name>.
Some other relevant options for the command are:
-
-fstreams the log. -
--tail=<n>displays the last<n>files from the log. -
-pprints the logs from the previous instance of the container in a pod, if it exists.
You can view the complete set of options using kubectl logs --help.
This command is typically useful during early development stages, when there is only a handful of pods. An application typically consists of multiple replication controllers, each of which may create multiple pods. Existing pods may be terminated and new pods may be created by Kubernetes, based upon your application. Viewing application logs across multiple pods and containers using this command may not be the most efficient approach.
Kubernetes supports cluster-level logging that allows you to collect, manage, and query the logs of an application composed of multiple pods. Cluster-level logging allows you to collect logs that persist beyond the lifetime of the pod’s container images or the lifetime of the pod or even cluster.
A typical usage is to manage these logs using ElasticSearch and Kibana. The logs can also be ingested in Google Cloud Logging. Additional logfiles from the container, specific to the application, can be sent to the cluster’s ElasticSearch or Google Cloud Logging service.
Debugging Applications
As explained in the previous section, debugging an application typically requires looking at application logs. If that approach does not work, you need to start getting more details about the resources.
The kubectl get command is used to display basic information about one or more resources. Some of the common resource names are pods (aka pod), replicasets (aka rs), services (aka svc), and deployments (aka deploy). For example, kubectl get pods will display the list of pods as follows:
NAME                        READY     STATUS    RESTARTS   AGE
couchbase-master-rc-o9ri3   1/1       Running   0          1h
couchbase-worker-rc-i49rt   1/1       Running   0          1h
couchbase-worker-rc-pjdkh   1/1       Running   0          1h
couchbase-worker-rc-qlshi   1/1       Running   0          1h
wildfly-rc-rlu6o            1/1       Running   0          1h
wildfly-rc-uc79a            1/1       Running   1          1h
kubectl --help shows the complete list of resource names that can be used with this command.
By default, basic details about each resource are shown. To display only the name for each resource, use the -o name option. To see a complete JSON or YAML representation of the resource, use the -o json and -o yaml options, respectively.
You can use -w to watch for state changes of a resource. This is particularly useful when you’re creating pods using replication controllers. It allows you to see the pod going through different stages.
With multiple applications deployed in the cluster, it’s likely that the pods created by each application will have specific labels. You can use the -l option to query resources, using the selector (label query) to filter on.
The kubectl describe command can be used to get more details about a specific resource or a group of resources. For example, the kubectl get svc command shows the list of all services:
Name:			couchbase-master-service
Namespace:		default
Labels:			app=couchbase-master-service
Selector:		app=couchbase-master-pod
Type:			LoadBalancer
IP:			10.0.0.235
Port:			<unset>	8091/TCP
NodePort:		<unset>	31854/TCP
Endpoints:		172.17.0.4:8091
Session Affinity:	None
No events.

Name:			kubernetes
Namespace:		default
Labels:			component=apiserver
			provider=kubernetes
Selector:		<none>
Type:			ClusterIP
IP:			10.0.0.1
Port:			https	443/TCP
Endpoints:		10.0.2.15:8443
Session Affinity:	ClientIP
You can use the kubectl get events command to see all events in the cluster. These events provide a high-level view of what is happening in the cluster. To obtain events from a specific namespace, you can use the --namespace=<namespace> option.
kubectl attach can be used to attach to a process that is already running inside an existing container. This is possible only if the container’s specification has the stdin and tty attributes set to true, as shown in Example 4-3.
Example 4-3. WildFly replica set with TTY
apiVersion:extensions/v1beta1kind:ReplicaSetmetadata:name:wildfly-rsspec:replicas:2selector:matchLabels:app:wildfly-rs-podtemplate:metadata:labels:app:wildfly-rs-podspec:containers:-name:wildflyimage:jboss/wildflystdin:truetty:trueports:-containerPort:8080
This configuration is very similar to Example 1-3. The main difference is the aforementioned stdin and tty attributes set to true in the container specification.
The kubectl proxy command runs a proxy to the Kubernetes API server. By default, the command starts a reverse proxy server at 127.0.0.1:8001. Then the list of pods can be accessed at the URI http://127.0.0.1:8001/api/v1/pods. Similarly, the list of services can be accessed at http://127.0.0.1:8001/api/v1/services and the list of replication controllers at http://127.0.0.1:8001/api/v1/replicationcontrollers. Other Kubernetes resources can be accessed at a similar URI as well.
You can start the proxy on a different port using kubectl proxy --port=8080.
The kubectl exec command allows you to execute a command in the container. For example, you can connect to a bash shell in the container using kubectl exec <pod-id> -it bash.
Containers within the pods are not directly accessible outside the cluster unless they are exposed via services. The kubectl port-forward command allows you to forward one or more local ports to a pod. For example, kubectl port-forward couchbase-master-rc-o9ri3 8091 will forward port 8091 on the localhost to the port exposed in the Couchase pod started by the couchbase-master-rc replication controller. Now, the Couchbase web console can be accessed at http://localhost:8091. This could be very useful for debugging without exposing the pod outside the cluster.
The kubectl --help command provides a complete list of commands for the kubectl CLI.
Check out the Kubernetes website for more details on debugging replication controller and pods, debugging services, and see GitHub for a more comprehensive list of debugging tips.
Application Performance Monitoring
You can monitor the performance of an application in a Kubernetes cluster at multiple levels: whole cluster, services, pods, and containers. Figure 4-2 shows how this information is collected.
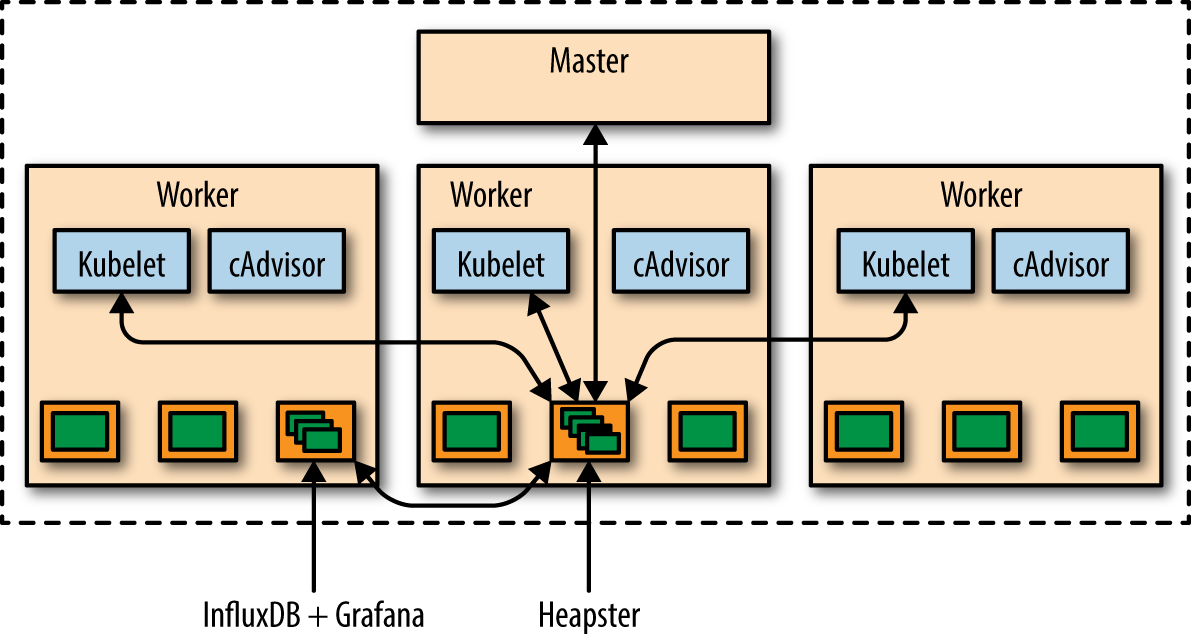
Figure 4-2. Kubernetes resource monitoring
The key components in this image are:
- Heapster
-
Heapster is a cluster-wide aggregator of monitoring and event data. It supports Kubernetes natively and works on all Kubernetes setups. Heapster runs as a pod in the cluster, similar to how any other Kubernetes application would run. The Heapster pod discovers all nodes in the cluster and queries usage information from each node’s Kubelet.
- cAdvisor
-
The Kubelet itself fetches usage information data from cAdvisor. cAdvisor (container advisor) provides information on resource usage and performance characteristics of a running container. Specifically, for each container it keeps resource isolation parameters, historical resource usage, histograms of complete historical resource usage, and network statistics. This data is exported by container and machine-wide.
- InfluxDB
-
InfluxDB is an open source database written in Go specifically to handle time series data with high-availability and high-performance requirements. It exposes an easy-to-use API to write and fetch time series data. Heapster in Kubernetes is set up to use InfluxDB as the storage backend by default on most Kubernetes clusters. Other storage backends, such as Google Cloud Monitoring, are supported as well.
- Grafana
-
Grafana is an open source metric analytics and visualization suite. It is most commonly used for visualizing time series data for infrastructure and application analytics. It is available out of the box in a Kubernetes cluster. The Grafana container serves Grafana’s UI, which provides an easy-to-configure dashboard interface for visualizing application performance in a Kubernetes cluster.
The default dashboard for Kubernetes contains an example dashboard that monitors resource usage of the cluster and the pods within it. This dashboard can easily be customized and expanded.
If you are using a Kubernetes cluster on AWS, then Heapster, InfluxDB, and Grafana are already available. If you’re using Minikube or Kops, then these add-ons need to be enabled.
You can obtain complete details about different endpoints in the cluster using the kubectl cluster-info command. The output looks as shown in Example 4-2.
Access the Grafana endpoint URI in a browser. Use kubectl config view to get the login name and password.
The cluster dashboard is shown in Figure 4-3.
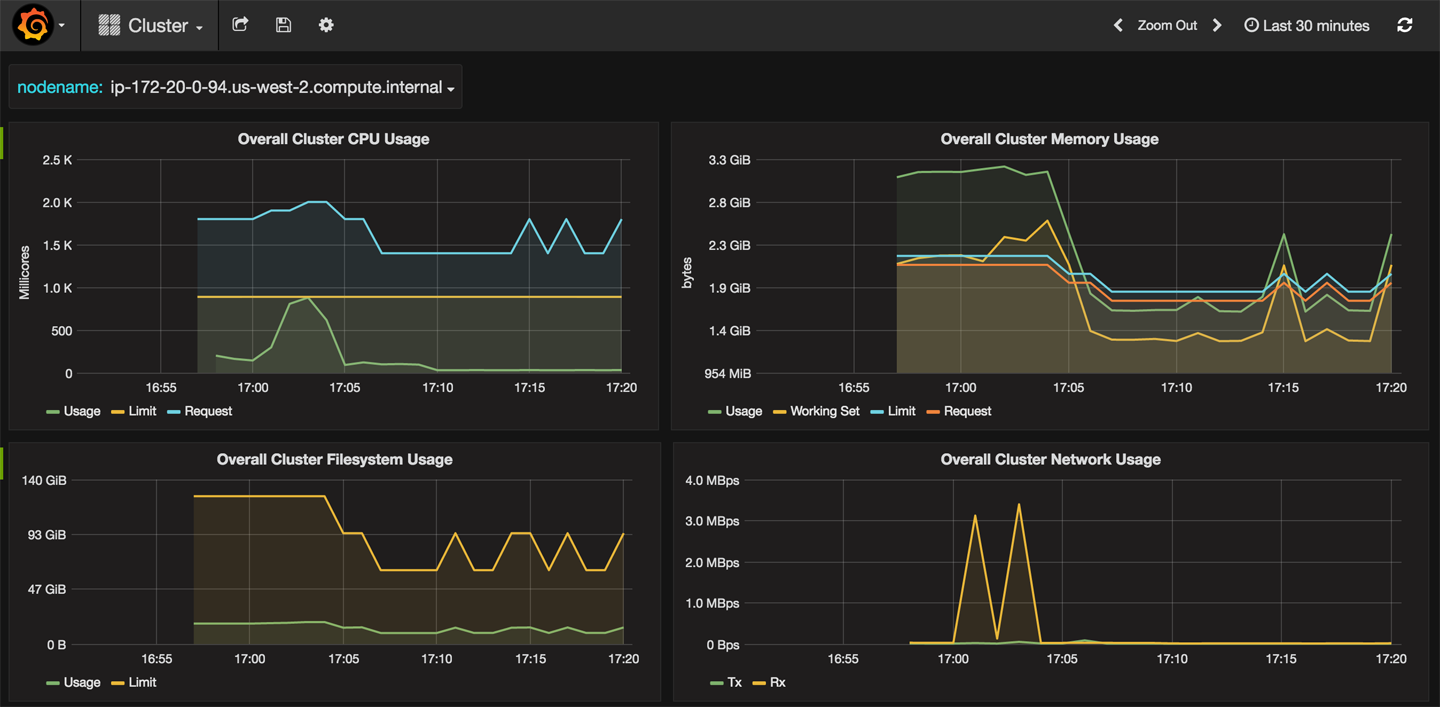
Figure 4-3. Cluster monitoring Grafana dashboard
The dashboard shows overall CPU, memory, network, and filesystem usage. This information is displayed per node as well. Additional data points can be configured on a custom dashboard.
The pods dashboard is shown in Figure 4-4.
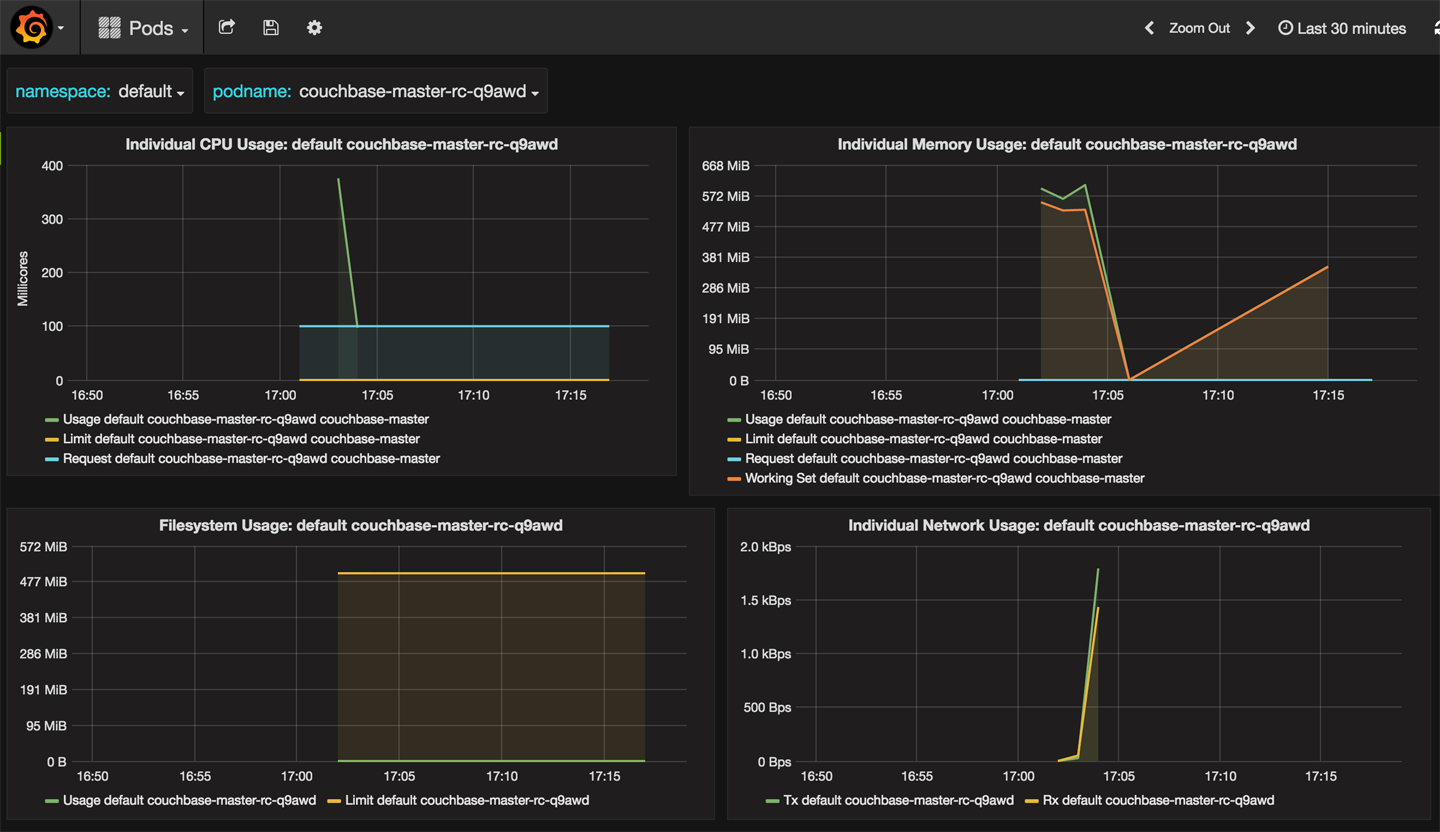
Figure 4-4. Pods monitoring Grafana dashboard
CPU, memory, network, and filesystem usage for a pod is displayed. You can choose different pods from the drop-down list.
In addition to the default monitoring tools in Kubernetes, some of the popular open source and commercial offerings are by Sysdig, Weaveworks, and Datadog.
Get Kubernetes for Java Developers now with the O’Reilly learning platform.
O’Reilly members experience books, live events, courses curated by job role, and more from O’Reilly and nearly 200 top publishers.

