Chapter 4. Building Your Business Case
Nate Gandert, Chief Technology Officer/Chief Product Officer Getty Images
Now that you have completed your discovery and made all the manual adjustments, it is time to build your business case. You may be wondering why you need a business case. Very few companies get a mandate down from the board level telling them to move to the cloud. It does happen, but usually there is some significant business objective that they need to address in those scenarios. For the rest of us, we need to show why we should move to the cloud. Unfortunately, the story usually centers on costs, even though agility is the real business value.
When it comes to migration, costs are high. You must operate in two environments for some period, which drives the bulk of your expenses. You will have training, consulting, and potentially software fees as well. Migration also causes a significant disruption to your business units and their timelines. To be blunt, moving forward with migration without having the buy-in of senior leadership is a sure way to get walked out the door. The business case conveys the information that you have gathered about your environment and relays that to management in a digestible format.
The bulk of this chapter will address hard costs, because they are the easiest to get business alignment on and approval to migrate. There are also a few areas to highlight where your costs might go up when you compare them to on-premises. In these situations, it is essential to highlight the additional benefits your company will receive from them. The story really should be more about agility and the capabilities your company will get by moving to AWS. Agility is not always quantifiable. That makes it hard to use in your business case since you cannot directly tie savings or increased revenue to that agility. All is not lost, though; there are some agility benefits you can quantify, and we will cover those in this chapter.
An unseen benefit of the business case process is that senior leadership may ask some questions and require investigation that you hadn’t thought of previously. This process guarantees that all the bases are covered and ensures a higher level of long-term success.
Estimating Your Timeline
To craft a proper business case, you need to know how long your migration will run. The length of your migration has a significant effect on the cost of your migration. It will affect your double expenditure, tooling, and any consulting fees. We have not discussed migration planning yet; we will cover it later, in Chapter 7. For now, we will estimate the length based on three factors:
-
The number of servers you have to migrate
-
The number of servers you estimate can be moved per day
-
A buffer for unexpected timeline delays to create the estimated timeline.
Number of Servers
The bulk of the effort in migration comes from the number of servers that you have on-premises. It boils down to the logistics of touching those servers and moving them. You will have to install agents on the box to migrate it to AWS, disable network adapters postmigration on the source server, perform a smoke test, and conduct other operations during your migration. Even with automation, it will still be the largest bucket of time.
Number of Servers Moved per Day
Calculating the number of servers that can be migrated per day can be tricky. It depends on the level of AWS experience of the staff that is performing the migration. It also depends on the types of applications and whether the staff has done migrations in the past. When I was a consultant and computing the level of effort for projects, I would use two servers per day per engineer. These were experienced AWS engineers with multiple migrations under their belt. It would be safe to use this number if you are using consultants or contractors. If you are using your staff, you should target one half to one server per day.
You may ask yourself how your engineers will start the migration and have a server migrated every day. That is a very good question; these numbers are averages. When you migrate servers, you do it in waves and typically have a cutover at night or on the weekend. You might migrate 10 servers with 2 engineers on Saturday, but it would take all week to do the prep work.
Delay Buffer
Delays happen. I do not think I have ever had a project that wasn’t delayed. In my management’s eyes, I do not miss any targets because I am adamant about including a buffer. Early in my career, I used to keep my timelines tight because I thought it would look good for me to propose a project with a short and optimal timeline. The first time I had to extend a project was not that big of a deal. But the third, fourth, and fifth times, I started to cringe every time I had to tell management I had to extend the timeline. This oversight was a painful lesson to learn.
Since then, I typically like to err on the side of caution, or as I call it, pulling a Scotty. If you think back to all those Star Trek episodes, they always asked Scotty to do something incredible. The timeline he was given was always too short to accomplish the task, and he would give a longer one. However, somehow Scotty would still pull it off and beat his estimated timeline. For his efforts, they always saw Scotty as the hero. I like to be Scotty when I run forecasts. I would rather estimate a little higher and be praised when the dust settles than shoot low and miss it. It is better to strap on a little extra rocket power to reach exit velocity and not need it than come up short.
For migrations, I would typically add a 10–20% margin of error as a buffer to the migration timeline. If working with an experienced migration team, I would lean toward 10%. Likewise, I would shift toward 20% with a less-experienced team. Besides the team’s capabilities, what type of software you have also affects the migration timeline buffer. For instance, if you have a lot of COTS applications, your timeline has less risk than if you have a lot of internally developed software. The reason for this shift in risk is that COTS applications are highly documented and have been moved to AWS by other companies. Blog posts and forum answers are available to help your team resolve any issues. When you have a lot of internally developed applications, the reverse is most likely correct. Typically, documentation is not as strong, and a high degree of tribal knowledge has been lost over time. Since you are the only company that runs the software, there will be no resources on the web to reference either. Because of these factors, I push the buffer toward 20% for companies with large estates of internally developed software.
Before we can move on to see how to incorporate the delay buffer, first we need to touch on employee vacations and holidays. They are a significant component of a migration timeline.
Employee Vacation and Holidays
An often overlooked component of timeline planning is employee vacations and holidays. Employee vacations can have a significant effect on your timeline, and I have seen it forgotten in quite a few estimates. Likewise, holidays can affect the timeline as well, but potentially not how you would expect.
I do not want you to fall into the trap of not thinking about employee vacations. Doing this will delay your migration. The effect gets worse the larger your company is, and the larger your team is, the more vacations you need to consider. The larger the company, the more servers and the longer the timeline, too. The longer the timeline, the more vacation the staff takes. Vacation will have less effect on small companies that do not have many servers, because the timeline will be so much shorter. Let us look at the following scenario to highlight how vacation can affect your timeline.
The impact on the migration timeline for Beth’s situation is sizable. Since she has six staff members on the migration and each have a month of vacation time, she has six months of potential vacation. That is half a year of a full-time person’s effort. Since there are roughly 20 workdays in a month multiplied by six months, that’s 120 days of effort if her team can migrate 1.25 servers per day, which equals out to 150 servers of missing effort if Beth does not compensate.
Holidays can also wreak havoc on your migration timeline. Most people immediately think about days off and people not being there to work. To be honest, that aspect has little effect on your timeline. What can really hurt is the potential blackout dates that come along with holidays. This is especially true in the retail industry. It is common for a retail chain to have blackout dates from Thanksgiving until after the New Year. That is around one and a half months of inability to migrate. One company that I worked for had blackout dates around every holiday. Valentine’s Day, St Patrick’s Day, the Fourth of July, and more all came along with one-week blackouts. The impact because of holidays will be very specifically based on your company’s individual needs.
I like to compensate for vacation and holidays by decreasing the overall number of engineers that is put into the equation. In “Scenario 4-1”, Beth would reduce her number of staff from six to five and one-half engineers. This will resolve the discrepancy for the effort that is missing during their vacations. Now that we have all the components, we can move on to putting them into the timeline equation.
Putting the Equation Together
Now that you have the number of servers, the number of servers per day, the employee time off, and the buffer in mind, we can put it all together to come up with the total length of the migration. To do this, I have created an equation to use that will calculate your total migration period. It takes a number of inputs, which are the items that we have just discussed.
Equation 4-1. Timeline equation
Let us look at another scenario to see how a timeline might look with some actual data points.
Richard will end up with an equation that looks something like:
He has 1,400 servers that will be migrated by four engineers, who can move one and a quarter servers per day. Because half of his staff is trained on AWS, the assumption is that an engineer can move just over one server per day. Last, since Richard’s company has nearly all COTS and half of his staff have migrated before, a buffer of 13% makes sense. Richard’s staff works a standard workweek, so it all gets divided by five to determine how many weeks of total effort are necessary. Richard’s complete migration timeline is 63.28 weeks, or just about 14.5 months long. Based on the number of servers that Richard has, these numbers sound about right based on industry norms.
Now that the timeline is completed, we can start working on the business case. You may be wondering why the migration timeline was completed before the business case and not included as part of it. The fact is that it is inconsequential compared to the rest of the information that will be conveyed to management. You can simply note it and how you arrived at it in the assumptions, which we will discuss later in this chapter.
What Does a Business Case Look Like?
Typically, I have followed the format of starting a business case with a written narrative about the migration and the benefits that migrating to the cloud will bring the company. After the narrative, I follow up with a five-year financial forecast that paints the picture of the savings of moving to the cloud. Finally, I follow up with all the details and outputs of the discovery in an appendix for people to review if they want to. Typically, senior leadership does not concern itself with the nitty-gritty details. However, once a while, the members will want to validate details for an area they are responsible for. In the next few sections, we will dive into detail on each of the components of a business case.
The Narrative
The narrative is the most critical piece of the business case. It is your opportunity to communicate the business benefits that migration to AWS will have. I like narratives because you get to craft a story around the future success of your company. People are more engaged with a story than they are with a PowerPoint flush with a bunch of bullets. Reading a narrative engages people’s imagination and has enough detail for them to envision the future. Other forms of communication leave more questions than answers. There is only so much information that you can cram into a slide before it becomes incomprehensible.
Introduction
But where do you start? An excellent and logical place to start is an intro that includes the current state of your infrastructure. I like to focus on some positives and negatives, without any on-premises bashing. It would be best if you appeared impartial, or at least balanced. If you come across as bashing the current state, you run the risk of alienating the leaders that you are trying to get on board with your plan. Your company has been in business for a while, and on-premises has been doing the job. You are trying to convince the same leaders that you or your predecessor did before. These same leaders approved the purchase of the equipment and tooling that is currently running in the data center. Your predecessor might even be the CIO now, and you do not want to call their baby ugly. Doing so will not fare very well for approval, but it will win yourself a major detractor that might have the sway to stall the whole thing. Keep it factual and keep bias to a minimum, and you will gain more support.
FAQ
You have written your introduction covering the current state. Now it is time to start diving into the benefits that will be achieved by migrating to the cloud. The best place to start would be to review the FAQs that you created in Chapter 1. You have already spent significant time developing the questions that you feel will be asked by business units, development teams, and management. At this point, you need to build a compelling story around those specific questions. Let us take a look at this FAQ example and how you might craft a compelling story.
As you can see in “FAQ Question 1”, we did not take a hard-line, negative stance against the on-premises infrastructure. We stated that there would be some benefits from migrating to AWS. The narrative also leads them down a path that hopefully fills in the details they need to form an opinion and limit questions. Let us take a look at how you shouldn’t write a narrative.
As you can see, this FAQ takes a very different position in the way that it tells a story. The narrative comes off very biased toward the cloud. It also paints a pretty bleak picture for the current state on-premises. The problem that you will run into, using this stance, is that it is your job to ensure that all these discrepancies are addressed. Writing a narrative like this might be signing your own death warrant.
You can continue to progress through the FAQ and pick out the questions where you can build a compelling and exciting story. Some items, like converting to SSD using gp2 EBS volumes, might be a fascinating story to someone technical. However, it probably will not resonate very well with upper levels of management. Using the wrong questions can bore your audience and slow excitement.
Closing
The last part of the narrative should be the closing. It should include a short recap of the essential items that you have discussed. In my closings, I like to envision the future and highlight capabilities that have not yet been used by the company but could be after migration to AWS. The closing is where you can put some out-of-the-box thinking in play and create a vision of some new capability or added customer value. Once your migration is complete and your data is in AWS, there will be a whole host of capabilities that you can tap into. Artificial intelligence and augmented reality are two prevalent technologies that people are thinking of new and creative ways to use across a host of industry verticals.
Warning
I tend to stay away from silver bullet technologies for my envisioned future. These would be technologies that, for some reason or another, get massive amounts of traction for solving every problem on the planet. The most recent one is blockchain. Not too long ago, you could not read any tech website without a mention of blockchain to solve a problem. Tennis elbow? Not a problem; rub on some blockchain twice a day. There is no such thing as a silver bullet. In my experience, any technology that is touted as a significant change rarely becomes one. It either dies or becomes a niche player. Blockchain, grid computing, next-gen firewalls, and others have all been on the solve-the-world’s-problems train, and they have all derailed. Technologies that change the world take a long time to do so. Look at virtualization, artificial intelligence, virtual reality, and even AWS. These technologies took at least a decade or more to reach a level of maturity to change the world, and some are just starting to gain traction. You want your picture of the future to be obtainable and not fanciful.
The Forecast
You have now written your narrative and painted a wonderful picture of all the benefits and issues that will be resolved by moving to the cloud. Now it is time to get to the brass tacks. You will have to show how much the migration to AWS will cost. Nothing is free, especially when it comes to migration. The double-spend during migration is a major hindrance. However, the spend will not come out to be exactly twice. You should see a cost differential between on-premises and the cloud. In addition, you should see some burn-down on the costs of your on-premises equipment as you migrate. When it comes to burn-down, there is some complexity, and we will cover that in greater detail later, in “Cost Burn-Up/Burn-Down”.
The important thing to capture in the forecast is when you will start to save money by migrating to AWS. Any good senior leader or board of directors will recognize that the savings will not be instantaneous. It is safe to say that a typical board will look at a three-to-five year return on a major investment like migrating to AWS. Typically, I have seen a return on investment in as little as 18 months, depending on the company’s situation. However, I would say that two to three years is probably more common. There is a possibility that companies do not save money by migrating to AWS. Let us look at a scenario that details how this might occur.
Hopefully, you can see some significant issues with the way Stefan’s firm has deployed the infrastructure. The biggest problem is that there is no redundancy in anything it is doing on-premises. The company probably does not have fire suppression, generators, or physical security. From a technical standpoint, there is no redundancy for the server or its storage. Stefan’s predecessor ran the environment as thin as they possibly could. When you compare this type of on-premises deployment to AWS, it could easily cost twice as much to run in AWS. AWS has all these capabilities built in, and it would be impossible to get the costs to align. In this scenario, it is vitally important to focus on the availability benefits that AWS brings to the table over the on-premises environment rather than costs.
The forecast should include several items over a period of at least five years. A good forecast will include:
-
Estimated run rate
-
Costs for migration, like tooling and consultant fees
-
Run rate modifiers, like reserved instances
-
Agility savings
Some of these items, like run rate, will come from your discovery, and some, like agility savings, will need to be calculated by hand based on your company’s situation. You will want to paint a picture using very high-level costs so that it is easy to digest and understand. The forecast should fit on a single page and should have no more than 10 to 15 rows of data. Add any more, and you risk confusing your audience. Providing spreadsheet after spreadsheet of server lists will not help anyone understand the bigger picture. That information can be saved for the detail section at the end. In addition, some items, which I call run rate modifiers, will adjust your overall numbers to approximate costs, like reserved instances.
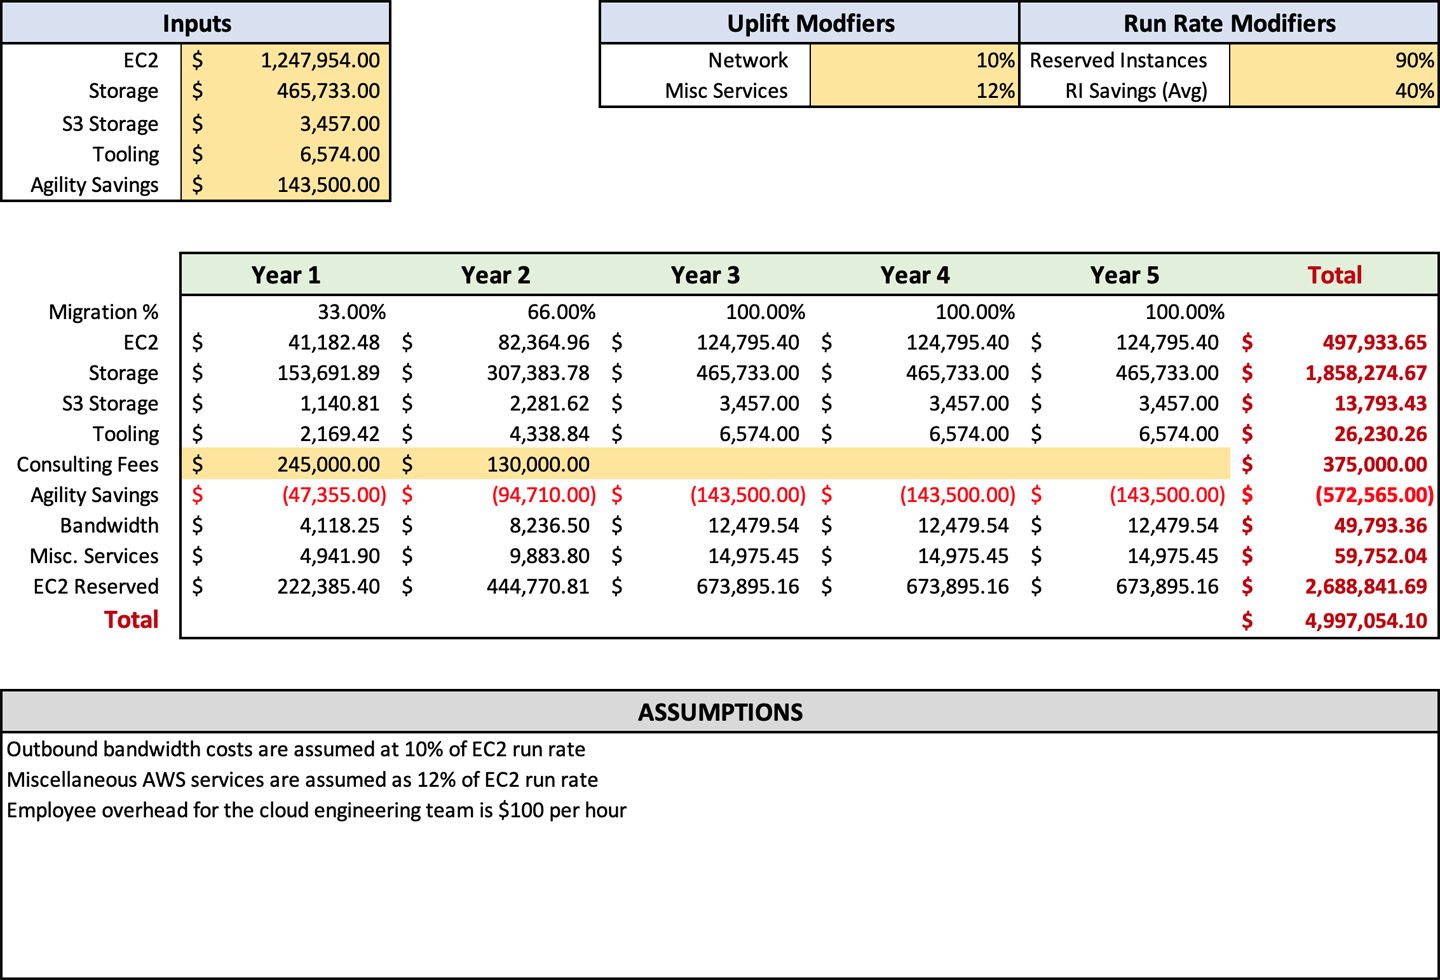
Figure 4-1 shows an example of a typical forecast that I would create. It includes all the essential details but makes them as digestible as possible. You can also see that I include a list of assumptions at the bottom that detail where those assumptions were made. You can make the format anything you would like, but simplicity is key. You do not want to overburden the consumer with unnecessary details.
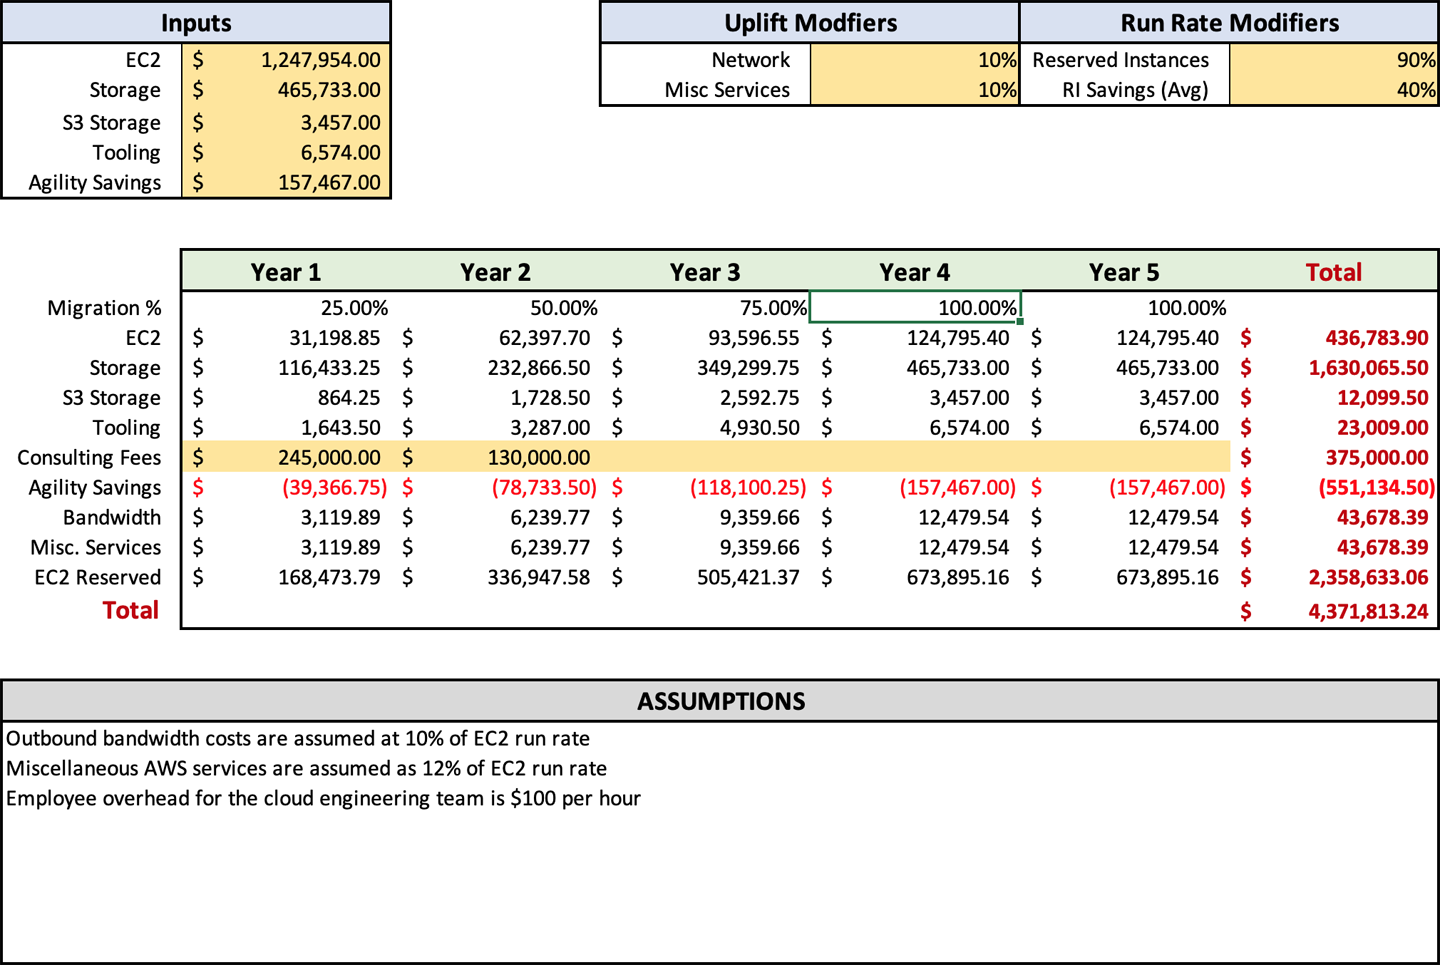
The last piece that we have to cover is removing the applications that you are not going to migrate to the cloud or, rather, trim the fat. Just like your rib eye at a classy steak joint, you want to remove the stuff from the edges that makes your migration less appealing.
Trimming the Fat
Before we can accurately perform run rate modeling, we have to trim some fat. The fat that I am talking about is the applications that you are not going to move to AWS. Amazon has created a methodology called the seven R factors (Refactor, Redeploy, Rehost, Repurchase, Retire, Re-platform, Retain). There were originally six, but Redeploy became a new R factor with more companies having containers or deployment pipelines on-premises. The factors exist to help you categorize your applications to determine whether and how you should migrate your applications to the cloud.
Your discovery tool found everything that you have on-premises and can provide you the right-sized instances. What the discovery tooling cannot do is tell you whether you should move an application. This classification will be a manual process that needs to be completed before we can do accurate run rate modeling. You, of course, do not want to account for costs in AWS that will not move or will be retired. That would inflate your numbers and make your business case less appealing and inaccurate. We are now going to touch on the seven R factors, what they mean, the estimated percentage of your migration for each R, and how you should apply them.
Refactor
Refactoring is the most complex way to migrate to AWS and should be the lowest percentage of your overall migration. Refactoring means converting an existing monolith and dated application into a new, highly decoupled, and cloud-native architecture. The problem with refactoring apps is that often it takes an extended period to complete the work. This extended timeline means that you are spending more on your overall migration running the application in two places or extending your data center footprint for longer periods. The biggest benefit of refactoring, though, is that you will run your applications more smoothly, have a higher degree of availability, have reduced management overhead, and save costs. Refactoring will probably be 5% or less of your migration at this point. In Chapter 8, we will discuss some low-hanging fruits that you can harvest in the initial migration.
Redeploy
The primary use of Redeploy is when you already have a deployment pipeline or containers on-premises. If you already have a deployment pipeline and are migrating, you are essentially changing the endpoint of that deployment. Most tooling already has plugins for AWS. Instead of doing any migration work, you will point the pipeline to AWS instead of to VMware or Hyper-V on-premises.
The same is true if you use containers. Since containers are self-contained workloads, you shift that container over to AWS rather than to on-premises hardware. Of course, there is some more work around migrating these types of workloads, such as DNS changes and whatnot, but the overall effort is lower than, say, a lift and shift or rehost. It is hard to say how much of your migration will be redeployed, because it is highly dependent on your applications.
Rehost
Rehosting will be the bulk of your migration, primarily for speed. When you rehost, you lift and shift the workload into the cloud. The faster it gets to the cloud, the faster you can start turning off resources on-premises. Speed is increased using the block-level CloudEndure replication tool. Rehost is the least sexy migration method but most often the most effective. You get a block-for-block copy of your server into AWS. Your migration will probably consist of 80% rehost workloads.
Repurchase
Sometimes software ages out in your IT infrastructure. These applications are often small, neglected ones that serve an important purpose but do not gain a lot of attention. This lack of attention lets them get old and decrepit, but they still work, so they never get replaced. When you migrate to AWS, it is a great time to age out these applications permanently and replace them with something newer. I have run into quite a few old Visual Basic programs in this category. If possible, I would look at replacing any applications with a SaaS tool, so you do not have to worry about maintaining it going forward. Based on my experience, repurchase will probably account for around 5% of your migration.
Retire
Sometimes you do not need software anymore once you move to AWS. Typically, this software boils down to infrastructure management tools that existed to maintain on-premises workloads. Things like log aggregation, Simple Network Management Protocol (SNMP) monitoring, and other monitoring tools are no longer required once you move to AWS and use native functionality. This reduction saves you both hard costs and soft management costs. The retire R factor is not used very much and will probably account for less than 5% of your migration.
Re-platform
When you re-platform something, you change a small aspect of the application, doing no major architecture changes. This change would be like converting from a database server to RDS. Another potential change would be to upgrade an older Windows OS to a newer, supported version. The key thing to remember here is that you are not making any major changes, like moving from Microsoft SQL to MySQL. Re-platforming is typically more prevalent than many other R factors in the migrations I have been involved with. There are quite a few older operating systems out there that it might surprise you to see you are still running. In addition, if you want to use RDS for peace of mind and to save on some management, you could easily see 20% of your migration be classified as re-platform.
Retain
The last R factor is retain. When you retain a workload, you leave it as is on-premises. Several items will show up in the retain column, but most of it will be applications that need to remain on-premises to keep your offices running. Active Directory would be a good choice to retain on-premises, because you want users to authenticate locally. Other systems might include security systems, Dynamic Host Configuration Protocol (DHCP) servers, and other network management facilities.
Legacy systems might be another item in this category. You will not be migrating your mainframe to AWS because it does not support the hardware. However, since these types of workloads were not detected through your discovery tooling, it will not affect your run rate and probably will not even be listed.
You will probably retain less than 5% of your infrastructure.
Now that you know how to classify all your applications, it is time to review and apply your R factors. When you are done, you will need to capture the run rate for the rehost, re-platform, redeploy, and refactor decisions. These are the run rates that will be put into your forecast. You will not enter them individually. Instead, you should sum those numbers up for a combined total.
Now that you have a high-level understanding of what goes into a forecast, let us dive into detail for the individual items. We will cover what the item is, why it is important to include, how to calculate it, and what assumptions to list. Microsoft Excel, Google Sheets, or a similar spreadsheet software will be required to create the forecast and perform the necessary calculations. A sample file is available as add-on content for this book. You can access the file at AWS Forecast.
Run Rate Modeling
The run rate that came out of your discovery process is one of the most important items that need to be included in your forecast. What we want to use here is your modified number that was output by your discovery tooling, which you then adjusted based on the manual discovery items your team reviewed and trimmed by using the R factors. When you start this process, you want to put the full run rate that you have come up with in the input cells for EC2 (C3), Storage (C4), and S3 Storage (C5). Later, you will apply formulas to adjust the numbers based on your inputs, but for now, start with the full run rate. As of now, your forecast should look something like Figure 4-2.
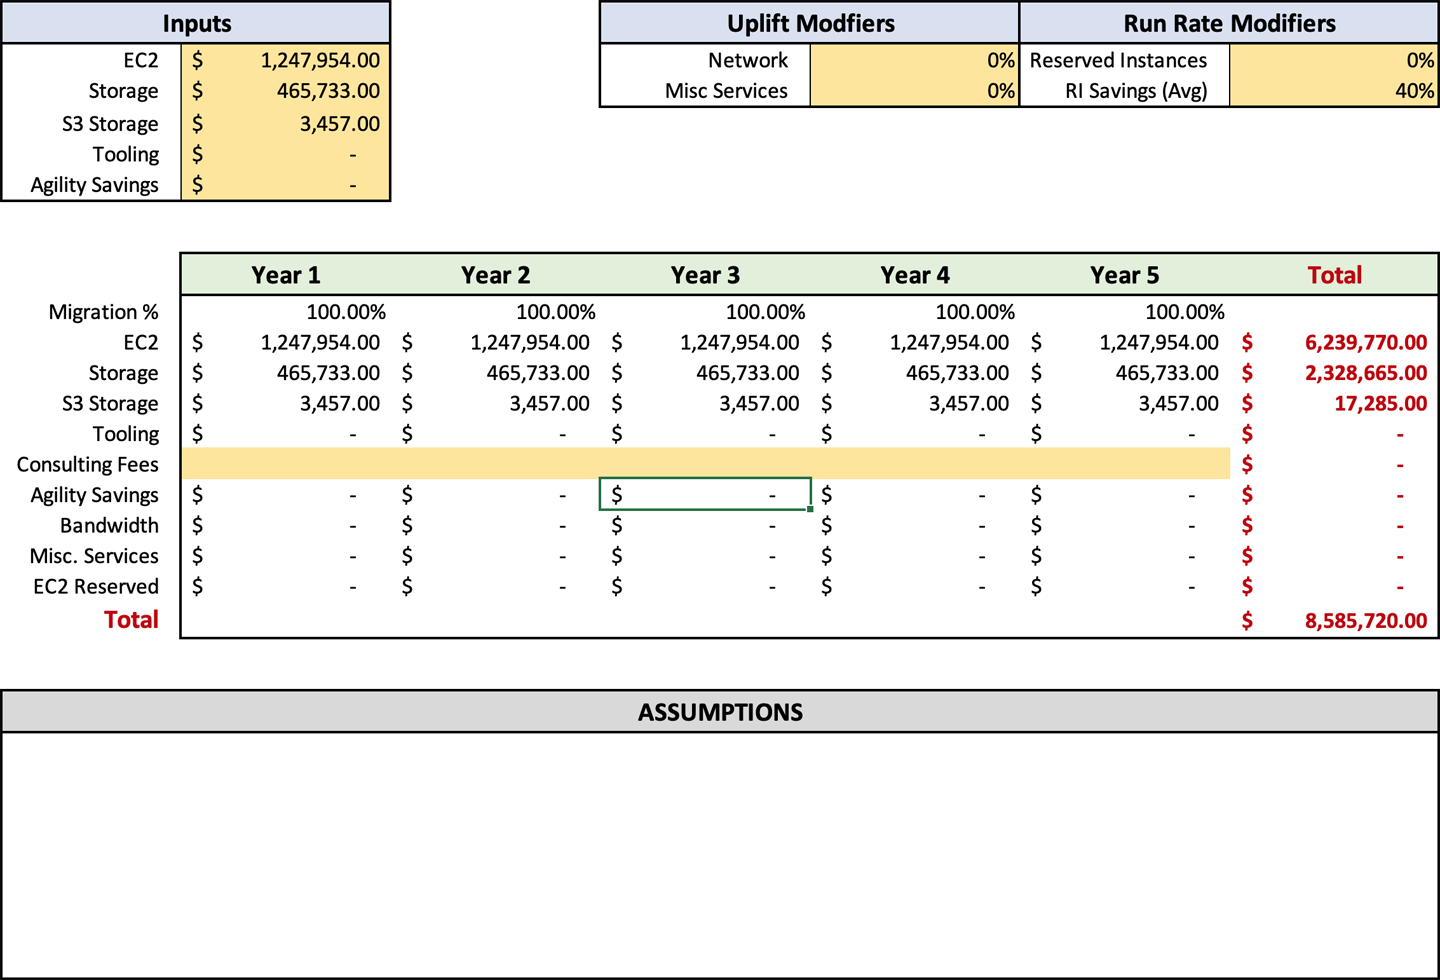
Breaking up storage and compute costs as shown in Figure 4-2 will make it easier to compute additional costs. In “Overall Outbound Bandwidth” and “Ancillary AWS Service Charges”, you may recall, I recommend adding an uplift to the EC2 spend for these items. Breaking out the compute and storage costs allows easier viewing and adjustment of those percentages.
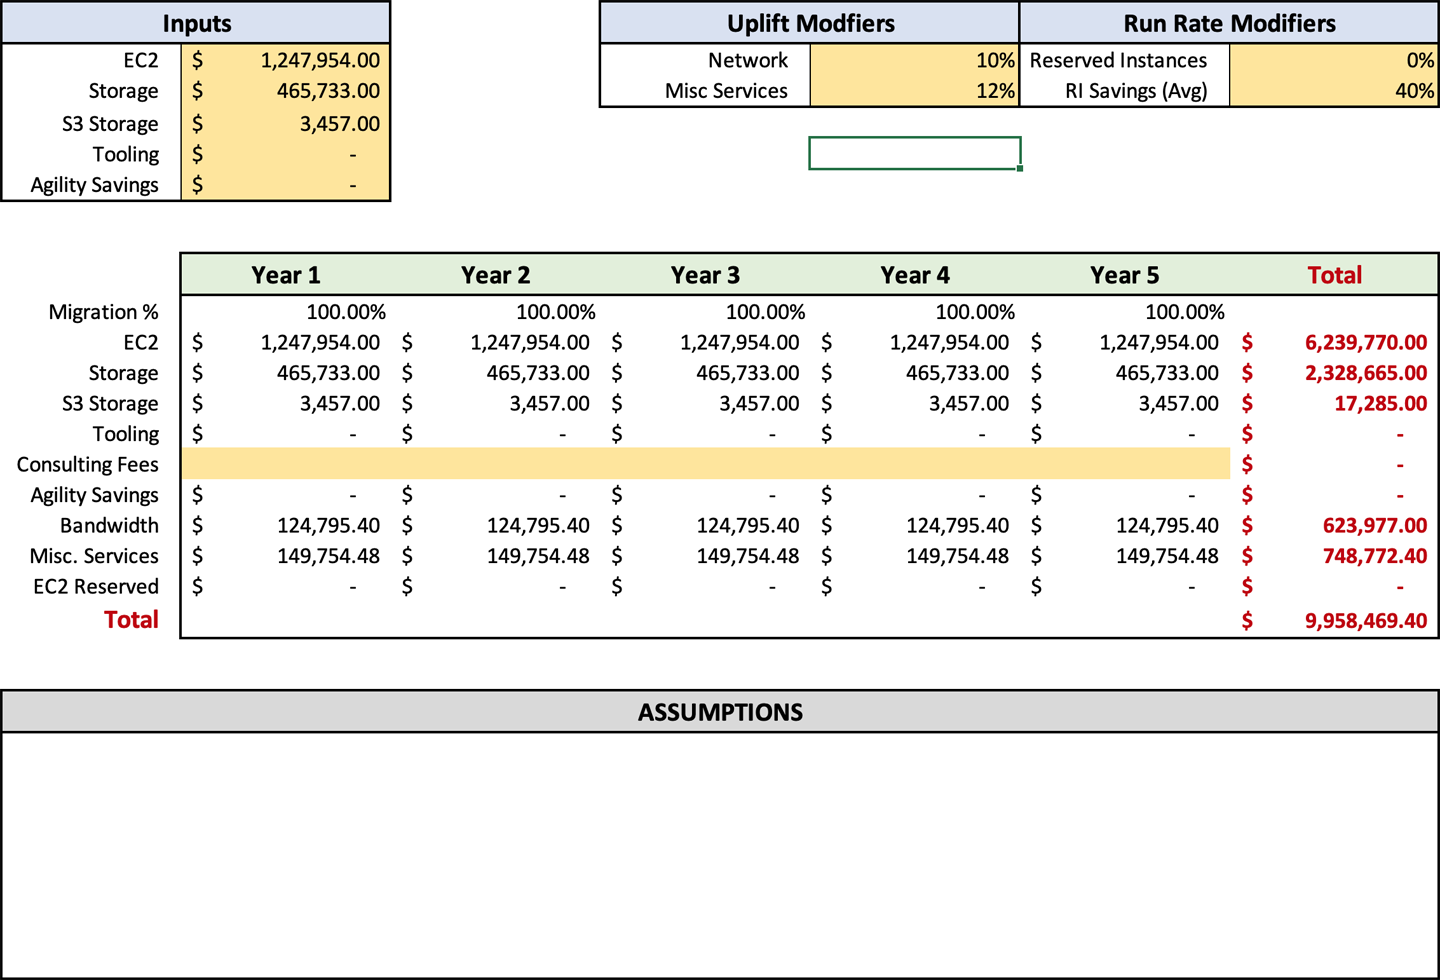
Once you have entered your run rates in the forecast, you can enter your uplift percentages in cells F3 and F4 for bandwidth and ancillary services, respectively. These are customizable, so you can manually adjust your settings if the output numbers do not align with your expectations. Sometimes you may need to adjust your settings up or down a few percentage points to arrive at a number that reflects your estimated usage. When adjusting, remember to be like Scotty from Star Trek and add a buffer. Once you enter this data, your forecast should look like Figure 4-3.
Migration Costs
Migration cost is not just about the double run rate between on-premises and cloud expenses. Cost is associated with staff time, tooling, consulting, and data transfer costs. When you combine all these expenses, you get an accurate picture of how much the migration will cost. Failure to include any of them can skew the migration cost significantly in favor of the cloud. If you do not include them, it gives any opposition the ability to discredit your business case and can potentially derail your initiative. I firmly believe in painting the most accurate picture I can. Most times, it is completely evident how the cloud will benefit the company and has a large potential to drive down costs.
Although I aim to provide an accurate picture, I do not focus on providing mundane and monotonous details. I also do not waste too much time trying to get “landing on the moon” numbers when “launching into space” numbers for many of these categories will do. In the next few sections, we will dive into these additional expense categories and how to account for them. We will also cover the potential pitfalls of calculating them and how to avoid wasting time.
Tooling costs
AWS has a whole host of tools to help you migrate to the cloud; some of them are free, and some charge fees. Although the tooling from AWS is great, it does not always have the features that your company requires to get the job done. When you run into this circumstance, you have to select an additional tool that will cost more.
Let’s run through the tooling AWS offers. These tools assist in migration, and you need to know how to account for those fees. Table 4-1 shows a list of the current tools available from AWS and their use cases.
As you can see, AWS has a healthy portfolio for migrating your systems and data to the cloud. These purpose-built tools fill their roles very well, but unfortunately, all have different consumption and costing models. These different consumption models can seem daunting when you first try to calculate them out. It is not that hard because we are going to estimate for many of them:
- CloudEndure
-
the AWS tool for migrating servers is now free after Amazon purchased it in 2019. Although the tool is free to use, there is a charge for the instances required to manage the replication. CloudEndure deploys a replication instance for every 15 source disks that you replicate. To estimate the cost of using CloudEndure, you need to find the maximum number of servers that you will be replicating during any of your migration waves. You will want to take the number of servers weekly that you calculated after reading “Estimating Your Timeline”. In “Scenario 4-1”, the weekly estimate was five servers. Since 5 is well under the 15 allowed, Richard would only need one replication instance. At the time of writing, a t3.medium instance in us-east-1 is $0.0416 per hour. Multiplying this price by 730 hours will result in a cost of $30.368 per month. Richard’s total cost of CloudEndure for his 14.5-month migration is $440.336.
- Snowball
-
AWS Snowball is a physical device that is shipped to your office. You then load this device with data and send it back to AWS. AWS will load all the data on it into S3. In all the migrations that I have done, I have never used Snowball. This is because the data you need to move needs to be relatively static. It takes days to load the data, ship the device, and have it loaded later. Ultimately, the companies that I worked with decided to send everything over the network rather than use Snowball. Using the network allowed them to bypass the synchronization that would be required after AWS loaded the data. If you do have data that would work well with Snowball, such as old backup data, Snowball costs $200 for a 50 TB device or $250 for 80 TB of storage at the time of writing. With that fee, you get 10 days of on-site time included. If you need the device for more than 10 days, you pay $15 per day. If you are going to use Snowball, I suggest that you prep your data and have everything ready to go before requesting the device through the AWS console.
- Server Migration Service
-
Typically, I do not advise using SMS. It only works with virtual machines and is not compatible with physical devices. For most companies, this means that you would need to use two tools instead of one. Since CloudEndure is free and does both physical and virtual machines, I suggest using that tool instead. SMS works by uploading snapshots of VMs to S3 and then creating EBS snapshots. Finally, SMS creates an Amazon Machine Image (AMI) for final consumption and deployment in AWS. An AMI is like a template in VMware terminology. The SMS service itself is free. However, because of the design, there are small numbers of EBS snapshots and S3 storage fees. Overall, these fees are modest and you should consider them part of the uplift for miscellaneous AWS charges we discussed in “Run Rate Modeling”.
- DataSync
-
DataSync is a newer service from AWS that facilitates moving data from on-premises to S3 or EFS on the file level instead of the server level. This service allows you to transfer data from a SAN or Network Attached Storage (NAS) device with Windows or NFS file shares to AWS. DataSync is a welcome addition as a tool. Before DataSync, most of this type of migration work was done with scripting and the AWS CLI, which was not the most robust solution. DataSync itself has a fee of $0.04 per GB in the us-east-1 region at the time of writing. This service is straightforward to forecast, based on the amount of data you need to transfer. For instance, if you had a NAS device with 1 TB on an NFS share, you would multiply 1,024 GB by $0.04 for a total of $40.96. The $40.96 does not cover the cost of the storage itself, so that will need to be accounted for as well. If it is a small amount of data, the uplift numbers you put in will probably cover it, but if you have dozens or hundreds of terabytes, you will probably want to include those costs as a separate line item.
- Command-line tools
-
If you have a small number of files to move to S3, then using the command-line tools from AWS would be the most comfortable option. None of these tools has a cost, but you will pay for the resources they consume. Since using the command-line tools is not advised for transferring large amounts of data, the uplift should cover the data consumption costs in the forecast.
- Schema Conversion Tool
-
The Schema Conversion Tool allows you to change the database engine for your database. This tool will enable you to switch from one database engine to another, for instance, Oracle to MySQL. The tool is only one piece of the puzzle, though. To change your database engine successfully, you will need to update your software to address the changes necessary in SQL nuances, triggers, and stored procedures. Fortunately, the SCT is free and doesn’t have to be accounted for in any forecasts.
- Database Migration Service
-
DMS allows you to transfer data from on-premises to the cloud using asynchronous mirroring. This service enables you to transfer data from a standalone server to AWS RDS. The benefit of using DMS is that it dramatically reduces your outage window for cutover when moving databases, because the service keeps the source and destination in lockstep. If you were to use a backup-and-restore method to transfer your database to RDS, you would experience a much larger outage window. The DMS service uses an AWS instance to do the heavy lifting of your database. It sits between your source and destination. This instance manages the communications and synchronization of the databases and is where the cost of DMS originates. For DMS, I would recommend an instance size of r4.large or larger. Some smaller instances are allowed, like T2/3, but I would not use those to transfer production workloads. At the time of writing, an r4.large instance in us-east-1 costs $0.21 per hour. Running this instance for a month works out to be $153.30. Each replication instance is limited to 20 sources and destinations. This limit means that you can only have 10 pairs of servers in replication per instance. If you need more than that, you will need to account for another DMS replication instance.
Note
If you are not changing database engines or moving to RDS, I would use CloudEndure to transfer the server instead of the database.
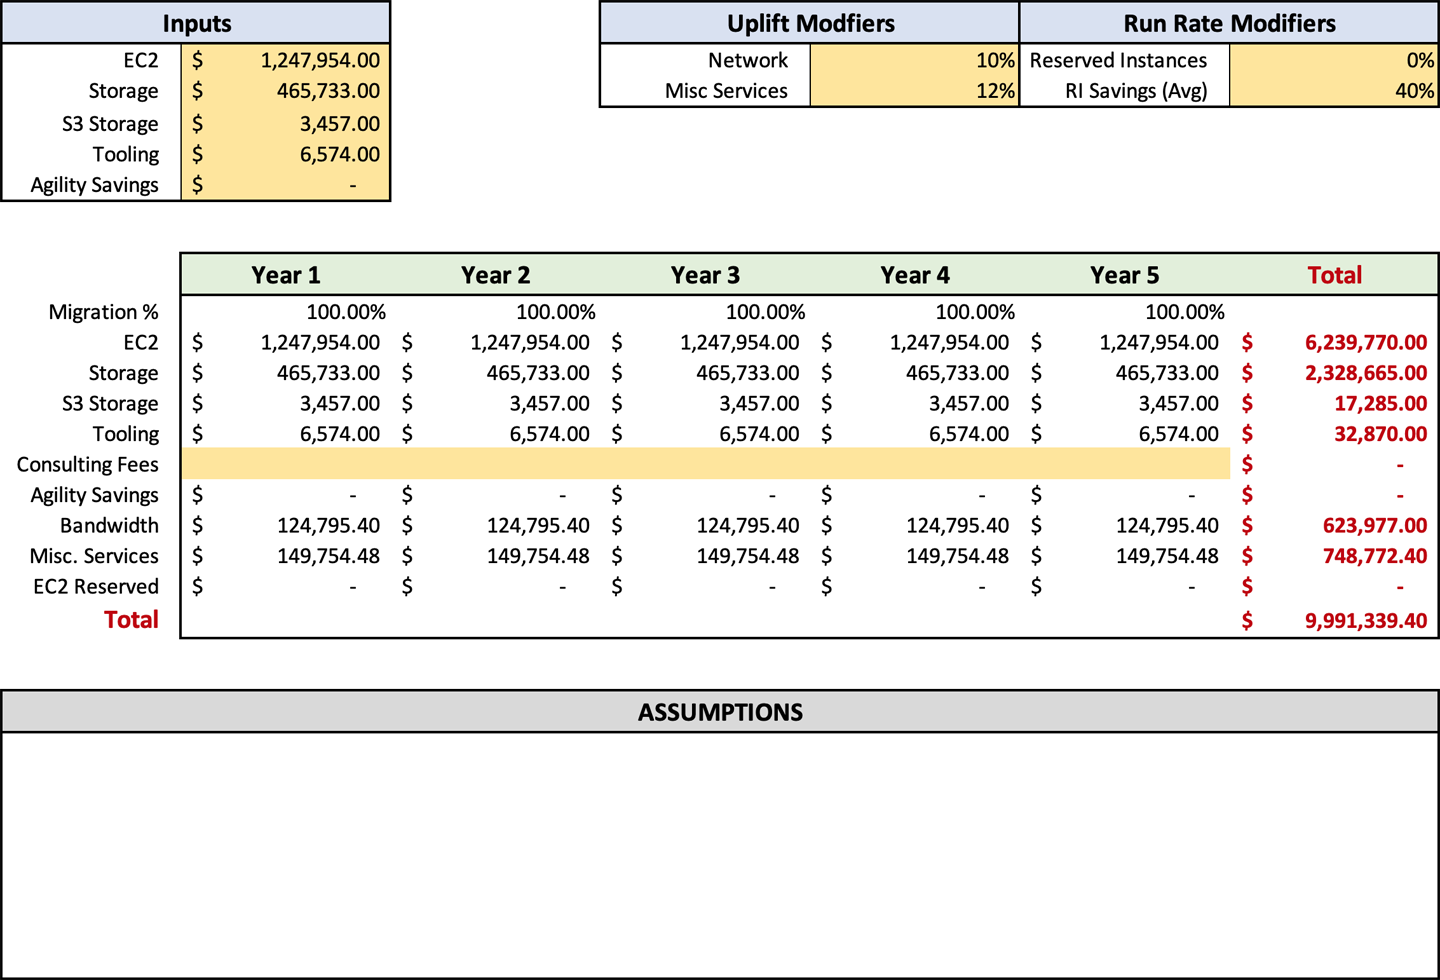
In Figure 4-4, you can see that I’ve included tooling in cell C6 on the forecast spreadsheet. The total of tooling should be inserted here. The spreadsheet will automatically populate the tooling in row 14 based on the migration percentages in row 10. We will discuss the “Migration percentages” and their use later. If you are planning to use any non-AWS tooling for your migration, you will need to get the pricing from the vendor and add it to the cost of any AWS tooling.
Consulting fees
In Chapter 2, we discussed “Contractors and consulting” and how they can reduce your business risks through their experience. Many times, consultants and contractors are looked at as expenses during a migration. However, it is important to demonstrate that their experience and capabilities will most likely decrease your timeline. They will also reduce overall risk during the migration. Using consultants is not something to be avoided but rather a tactical decision to help the company along and reduce its migration length. Overall, the dollar amount for consultants will not be small. People are usually the company’s greatest expense. Unless you have an existing budget that can cover consulting fees, it is important to put them into the migration forecast.
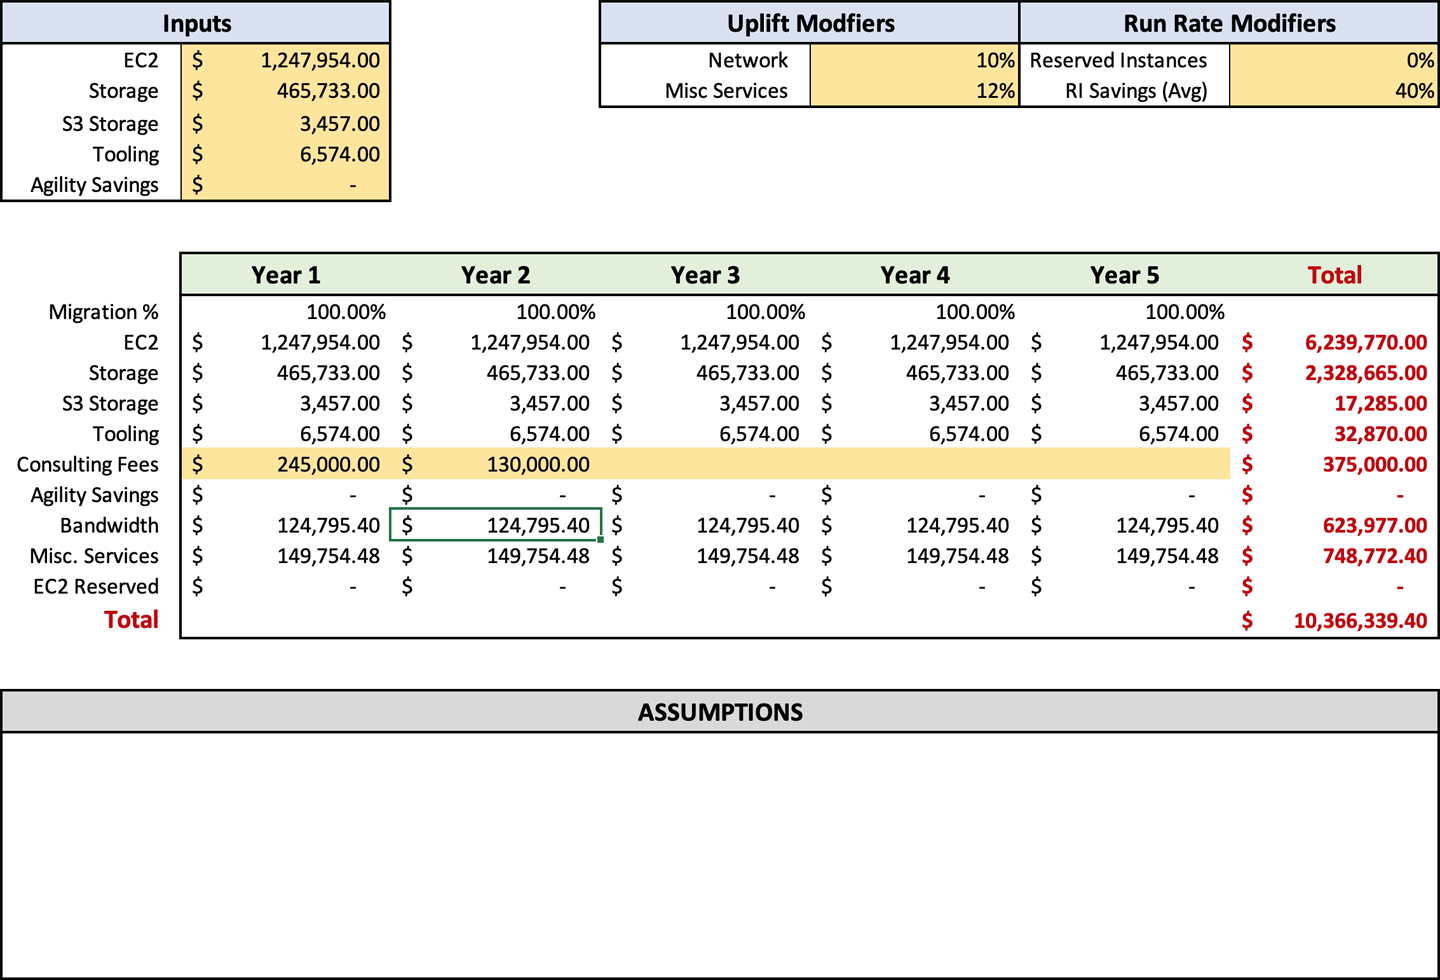
Consulting fees should be rather easy to obtain. When using consultants, you are offloading the management of your migration to a third party, along with the effort to move your resources. This abstraction allows the consulting firm to price out the entirety of the project for you. The consulting firm will provide you a statement of work (SOW) based on the items that you wish it to complete. The SOW will give you the total amount along with a set of success criteria and work expected to be done. This information can then be recorded in the forecast on row 8. Unfortunately, there is no standard way to split the consulting fees over the entirety of the migration, so you will have to split these fees over the migration years as you see fit. There are no modifiers on the sheet to assist.
When it comes to contractors’ fees, they are not as easy to obtain, because you need to calculate them manually. Since you retain management with contractors, you need to determine the level of effort for your migration. Right now, in Chicago, I know that contractors can get typically around $100–$150 per hour. Many contractors work through a placement firm as well, so you will need to add 35% on top of those fees if you use a placement firm. If you do not source your contractor, you are looking at $135–$195 an hour with the added overhead. High-end contractors who work with large enterprises can see rates as high as $300 an hour. Experience plays a big part in pricing for contractors. I would make sure to get certification validation numbers for any claimed certifications and validate that they indeed hold them at the AWS certification site. The more certifications a contractor holds, the more they will charge. You will want to make sure you are getting your money’s worth.
Another option for contractors to be released soon is AWS IQ, a service that allows AWS-certified individuals to register and offer their services available to companies using the platform. The service automatically validates their certifications when they register their account, saving you that step. The service also facilitates payment through the existing AWS marketplace system. The system allows your contractors’ fees to show up as part of your AWS bill, reducing the burden on your finance department. AWS IQ charges a minimal 3% fee on top of the contractors’ fee for the use of the service.
If you are using a search firm, AWS IQ, or a contractor directly, you will still have to estimate the number of hours you will need such services. Unfortunately, the amount of time you will need a contractor’s services is particular to your company’s needs, migration timeline, and current staff capabilities. You will need to assess all these items to determine how long and how many contractors you will require. Once you arrive at that length, you can compute how much it will cost to employ them for that period. Let us look at the following scenario to see what a contractor calculation might look like.
Working backward, Becca’s team can migrate approximately 90 servers per month. Currently, her timeline is six months too long. If you multiply 90 by 5, you end up with 450 servers that would not be migrated by month nine. If we divide the overage back into nine months, her intended target, we end up with 50. Becca will need enough contract staff to cover an additional 50 servers per month to meet her revised deadline. If Becca were to target contractors that have AWS experience and have done migrations before, she could get a migration rate of two servers per day from them. With 20 working days in a month, one highly experienced contractor could move 40 servers. Becca needs two to cover her overage and will decrease her overall migration risk, because a second contractor raises the monthly capability to 80 additional servers per month. That is 30 servers more than she needs, further reducing risk.
Based on Becca’s need, she will need to account for 2,880 hours of contractor expenses. I would suggest estimating at a higher rate of $188 per hour to ensure greater flexibility. Becca would enter $541,440 into the cell C15 for year one, as shown in Figure 4-5. We know that it is year one because her optimal migration timeline is nine months.
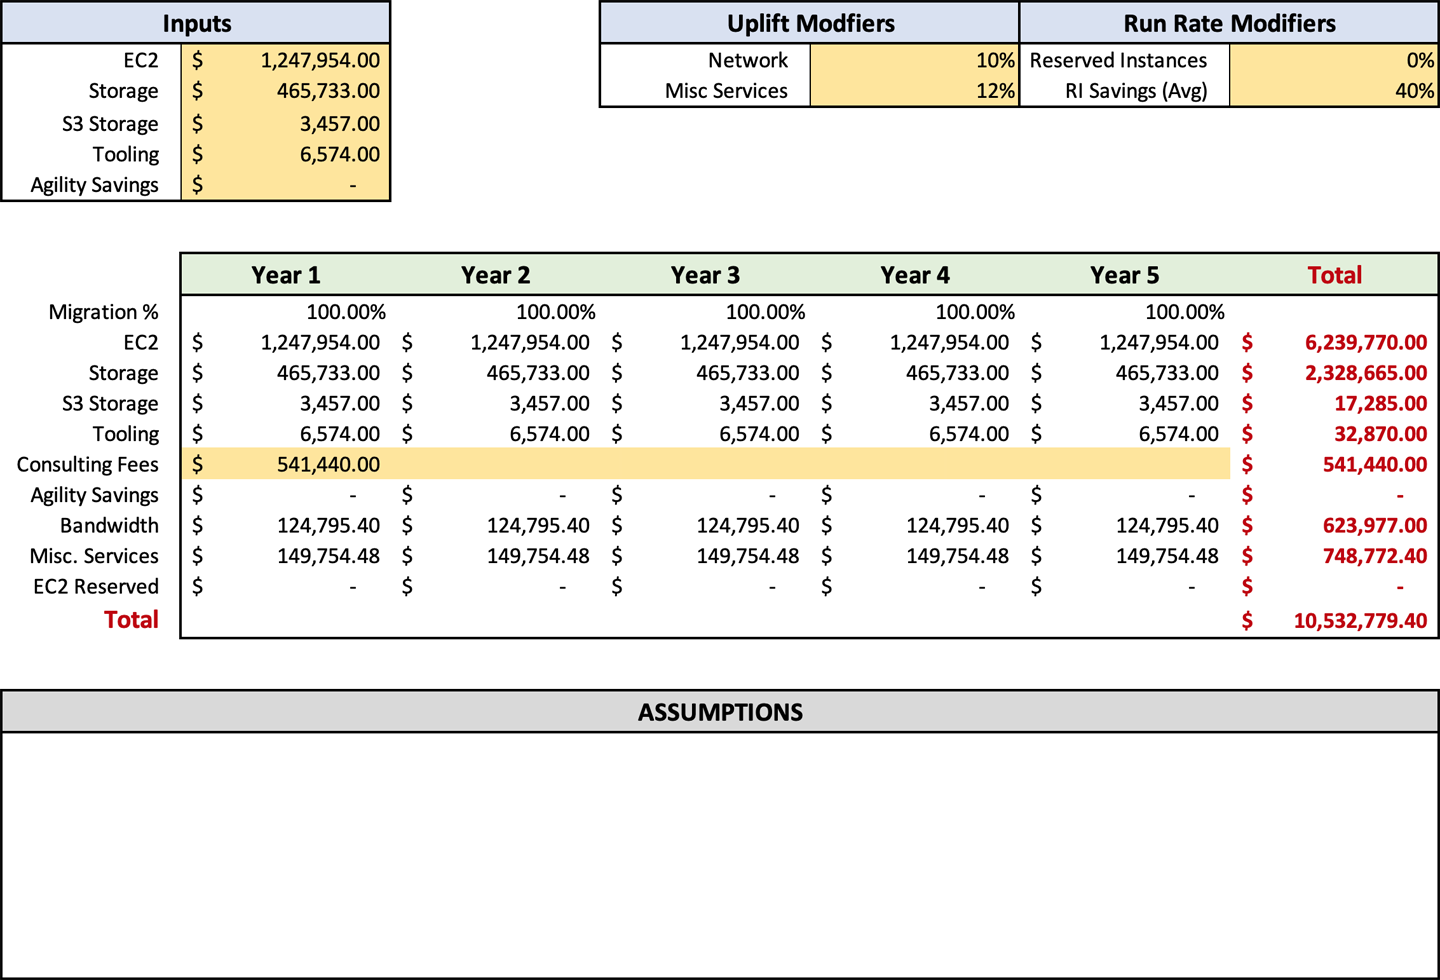
After computing your consulting and contractor fees, you will have an accurate picture of how much it will cost to perform your migration. The forecast sheet will also show you how much your ongoing costs will be postmigration, which you will be able to compare to your current infrastructure operating costs. I hesitate to say the return on investment when compared to on-premises, because often it is comparing apples to oranges. But I would say that for most companies, you will see a reduction in costs when you compare the AWS run rate to on-premises costs. After entering your consulting and contractor fees, your forecast should look like Figure 4-6.
Run Rate Modifiers
Now that you know how much everything will cost, it is time to apply run rate modifiers so you can adjust spend based on variables that are highly dependent on a company’s circumstances. A multitude of options can affect your run rate; that is one of the beautiful things about AWS. However, I will focus on the largest and most commonly applicable levers available. These levers are reserved instances, savings plans, migration percentages, agility savings, and management savings.
Reserved instances
Reserved instances (RIs) are probably the easiest way to save a significant amount of money running in AWS. A reserved instance is when you agree to use an instance of a specific type and operating system for a period of one or three years. By agreeing to use the instance for a longer period, you are offered a discount on the total run rate for that instance. The discount you receive is based on how long you purchase your RI for and how much you prepay. There are options to prepay all the instance cost, called an all up-front RI, down to no up-front prepayment. Of course, the highest discount is offered on the three-year all up-front RI purchase. RI purchases can save you an average of 40% for one year and 60% for three years. However, I am not a fan of three-year RIs for these four reasons:
- Contrary to agility
-
The number one benefit of AWS is business agility, so why would you lock yourself into a three-year instance? In three years, a new service might come out that is serverless or on-demand that might save you thousands.
- Instances improve
-
AWS continually releases new instance types; some of these are significantly faster than their predecessors. You have locked yourself into a Ford when you could have a Tesla.
- Cash outlay
-
You have to pay for your servers up front for the biggest benefit, so you have a large cash outlay like you do for on-premises operations (although you use amortization instead of deprecation).
- Decreased pricing
-
AWS drops the pricing on instances from time to time. With a three-year reservation, you’ve already bought it and can’t take advantage of the decrease.
You can resell reserved instances on a marketplace and purchase convertible reserved instances. These two capabilities allow you either to change your RI, as with convertible reserved instances, or to sell off, using the marketplace, but you have to ask yourself whether you really want your staff to be wasting time with these levels of mundane management. Or do you want them to add business value?
There are many reasons and methodologies to purchase reserved instances, and I could easily write half a book on the subject. I will instead focus on an easy way to adjust your forecast to compensate for purchasing RI. Including instance information in the forecast would reduce its life span and increase its complexity. Ultimately, we don’t need that level of precision. Instead, we will work with generic discounts based on RI type and length.
To adjust the RI footprint on the forecast, you change the percentage in cell H3. The percentage represents the amount of the estate that is not reserved. Typically, I recommend 10–20% to be left as on-demand. This on-demand buffer ensures that your RIs are always used. Since RI is based on OS and instance size, if you are not running an instance with that configuration, the RI will go unused. Therefore, leaving a percentage as on-demand ensures that all your RIs are used. The on-demand percentage also allows you to change your environment. For instance, after you migrate, you might update an application so that it can support auto scaling. By changing the application to use auto scaling, the reserved instances that were purchased for the application will be left available when the application scales back during low periods.
If your infrastructure has much auto scaling, then you may want to adjust the percentage up, and if you use a lot of COTS applications without auto scaling, and do not change often, you will want to adjust the percentage of on-demand lower. If your company is small and you do not have many servers, you will probably have an excellent idea about your estate and its growth. When this is the case, you will want to have a very low on-demand rate.
Savings Plans
In 2019, AWS released a new capability to buy compute resources called Savings Plans. Savings Plans offer a discount when you guarantee to use resources, just like reserved instances. The primary difference between Savings Plans and reserved instances is that Savings Plans offer a significant amount of flexibility. Savings Plans are purchased based on the amount of compute you intended to run per instance family. See Table 3-1 for a refresher. In addition, Savings Plans are not tied to any region as RIs are. This means that you can significantly reduce your risk and management overhead by using Savings Plans.
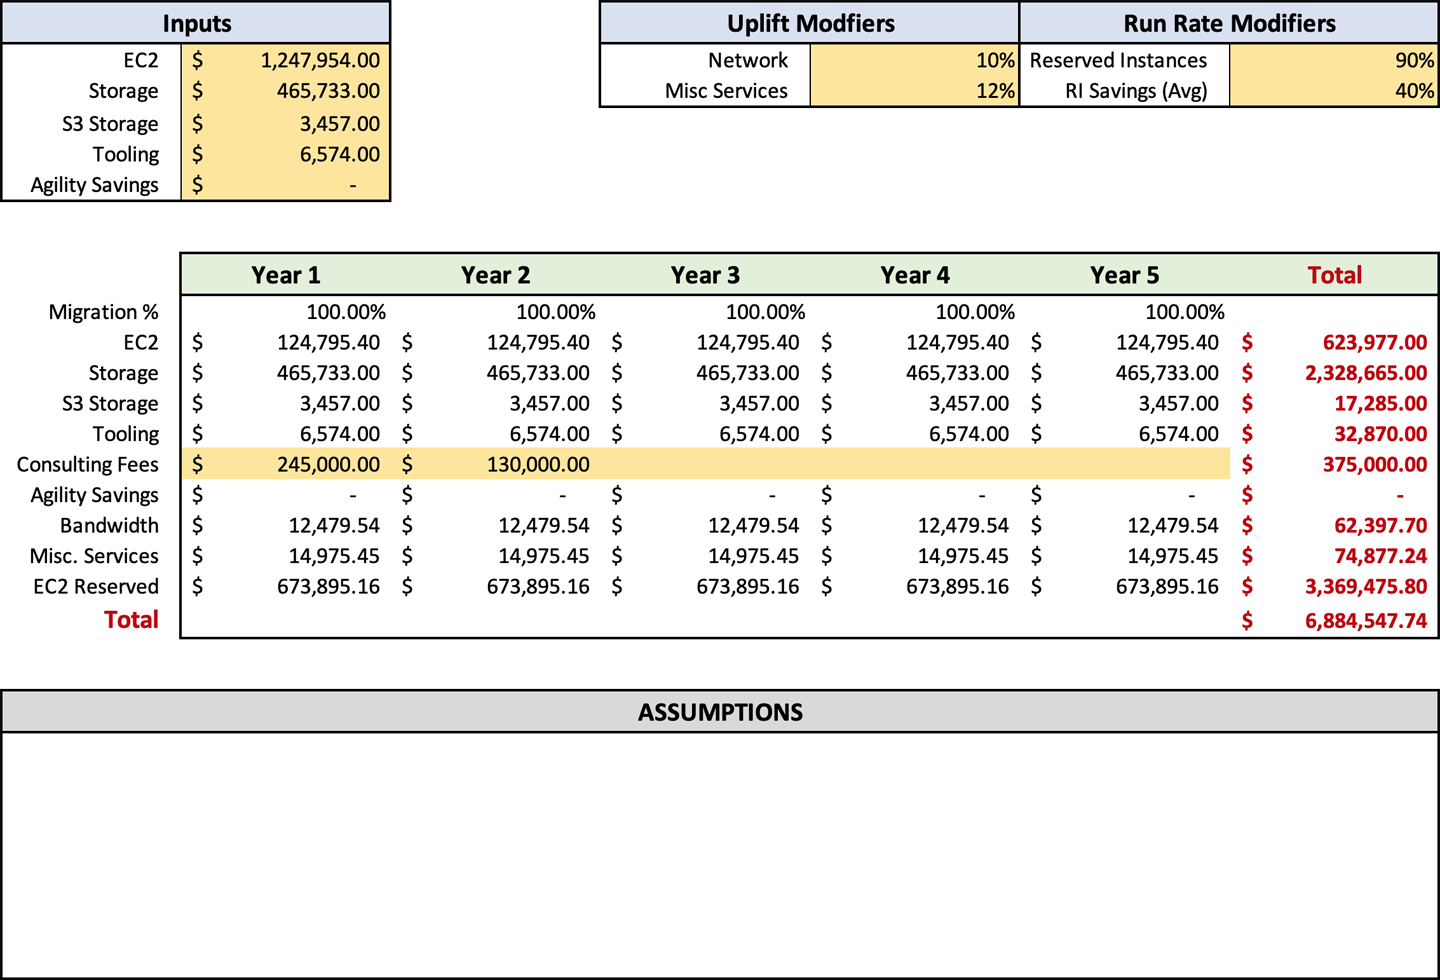
Of course, there is a potential downside to using Savings Plans. The level of savings in a Savings Plan is about 10% less than purchasing RIs. If you have a medium-sized business, then I suggest using Savings Plans. If you are a very large enterprise, the 10% decrease in savings might justify your increased employee overhead for managing RI purchases. For a small business, I would stick with RIs, because you probably know your compute infrastructure usage intimately. There are no specific cells to accommodate Savings Plans in the forecast template. If you plan to use Savings Plans instead of RIs, you should change the percentage in cell H4 from 40%, which is the average RI savings, to 27%. You make this change because the average cost reduction of a one-year savings plan is 27%. At this stage in the process, Figure 4-7 should be a similar representation of your inputs.
Note
You can use a combination of a Savings Plan and RIs. However, I would advise against doing this unless you really comprehend the ramifications of using both.
Migration percentages
Migrating to AWS is not an instantaneous process. No form of migration is an instantaneous process. If you think back to recent history, you will see the same timelines migrating from physical servers to virtual machines, even by VMware from one data center to another. In this regard, migrating to AWS is not anything new. It is only the capabilities that have changed.
You’ve already gone through discovery. You know how many servers you have. You have calculated how much work your team can perform, and you have accounted for contractors and consultants. You have entered all these values into the Microsoft Excel forecast. As it sits right now, you have five years of spend and each year is the same, the full migrated run rate.
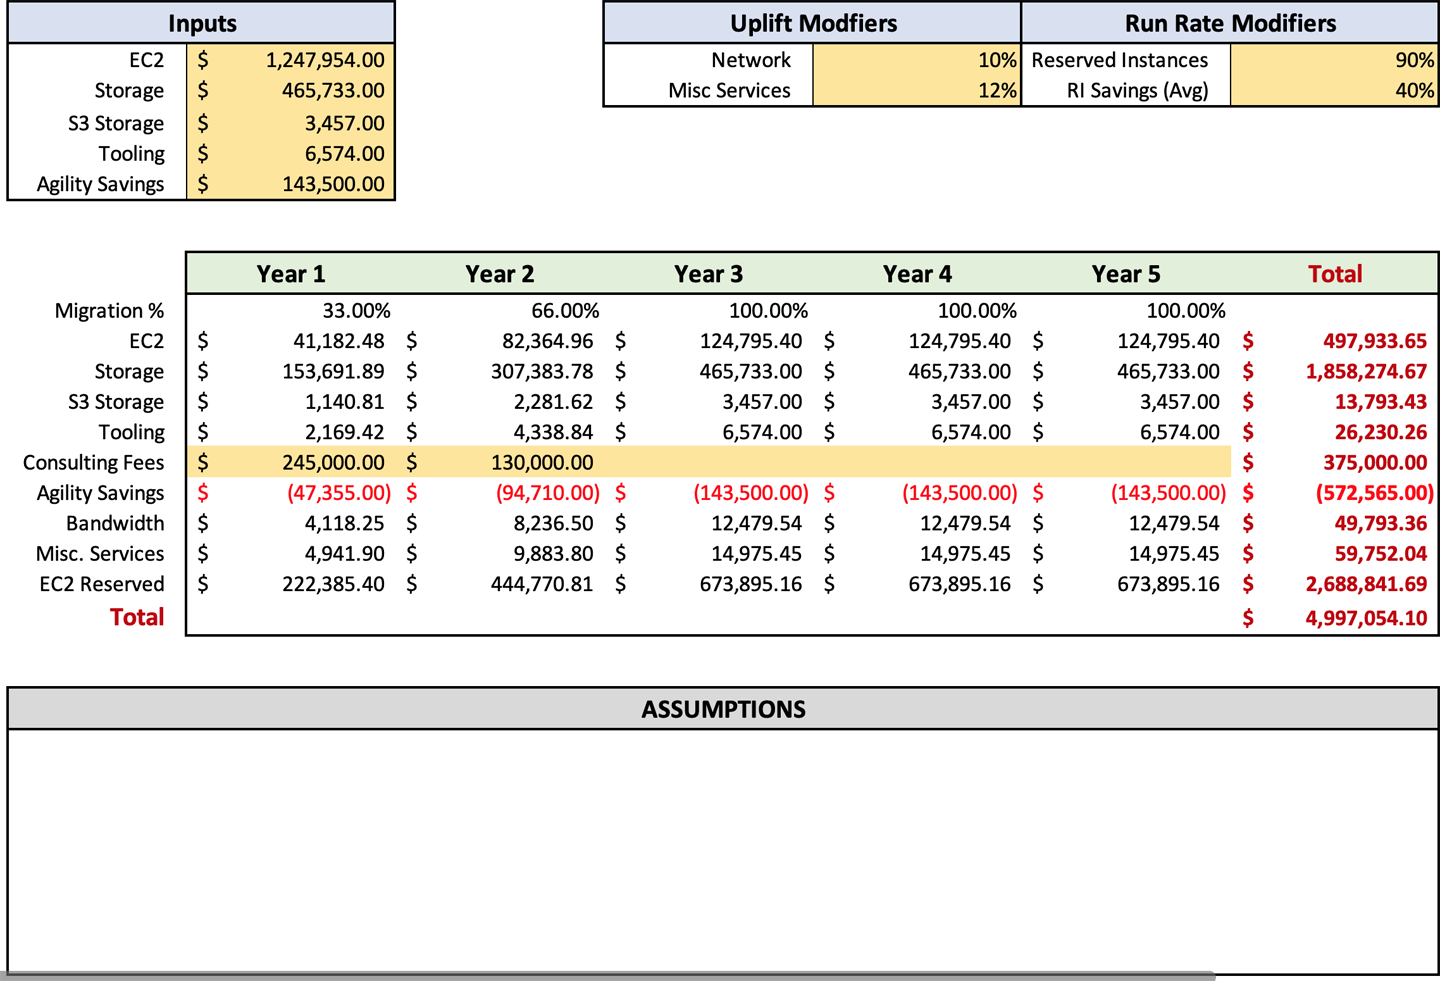
Since we are talking about run rate modifiers, we will adjust the migration percentages that are on row 10. The sheet starts with the value of 100% across all five years. It is as if a magical fairy migrated all your servers for you. Now you want to go back and adjust them based on your timeline. For instance, if you have a two-year timeframe, you have approximately 50% in year one, and years two through five will remain at 100%. If you have a three-year migration, it would be 33% for year one, followed by 66% for year two, and 100% for years three through five.
A large enterprise should anticipate a three-year migration timeline. A small business should be estimated at less than a year for its migration, and medium-sized businesses would be about two years. Once you enter all the information, it will automatically calculate the run rate based on those percentages.
You might have noticed that we are just working with percentages here, and this goes back to my analogy of blasting into space. We haven’t done migration planning and, therefore, don’t have the minute details. Like many processes before, we don’t want to get stuck in the tar of more information right now and have it slow down your migration process. We will cover migration planning later, in Chapter 7, and cover the timeline in more detail. At this stage in the process, Figure 4-8 should resemble your inputs.

Agility Savings
When assisting companies with migrating to AWS, I always emphasize the importance of doing as much lift and shift as possible: copying servers block for block to AWS, not focusing on refactoring or making significant changes to the application or infrastructure. I make this suggestion because while you are migrating, you are spending twice as much. I focus as much as possible on decreasing the timeline and decreasing those costs. There are a couple of areas that I do recommend capturing the low-hanging fruit for agility and management savings. I would not classify these changes as refactoring but rather as augmentation. These are changes that I recommend companies take advantage of and are easy to obtain.
After all, agility and reduced workload are the main reasons people want to migrate to AWS. It makes sense to take advantage of some of those capabilities from the get-go. I will talk primarily about deployment pipelines and the AWS Service Catalog. These services are the most effortless capabilities to consume. They can even work with COTS applications, making them applicable to nearly any workload and company.
Automated deployment
Deployment pipelines are what many associate with internally built applications, but that is not always the case. Pipelines could be used for the deployment of COTS applications as well. Typically, I see deployment pipelines for COTS applications in highly secured environments. In a high-security environment, you would want to rehydrate your servers every week. Rehydration is the process of destroying the old machines and creating new machines with the latest patches and applications installed. You would do this in a high-security environment because it ensures that any potential malware, virus, or trojan is removed. Rehydration helps reduce the attack footprint of the COTS servers and can be a vital tool for managers in regulated environments such as financial services. However, for most people, you want a deployment pipeline for your internal applications.
Deployment pipelines help significantly reduce the manual overhead associated with deployment and testing. On-premises, you most likely have an individual on the engineering team or operations team who would receive the application once it was built and deploy the application. Not only does this cost your company hard dollars with manual effort, but it is a tedious and mundane task that can demoralize employees. Manual deployment is also prone to human error, which leads to security concerns and customer outages. By employing a deployment pipeline, you reduce all these risks and their associated costs.
The service that Amazon has for pipelines is called CodePipeline. It can be triggered manually by a person or automatically triggered based on several triggers, such as when a new file is deployed to S3 or when a new check-in is made in your code repository, or you can schedule it with a CloudWatch event. Out of these options, I have seen most companies deploy automatically after a code check-in. You could also create a pipeline that has to be triggered manually, although I have not seen it in practice. However, I do see manual checks implemented in an automatic pipeline, such as approvals before the production release.
CodePipeline has many capabilities. However, we will look at a few key capabilities, such as automated unit testing, load testing, and other functions that help reduce employee overhead further. CodePipeline does charge for its use. However, the cost is very low unless you have some very specific use cases. These might be when you are using a lot of unit testing or load testing that would increase the cost. I would say that the uplift for miscellaneous AWS services that you already have in your forecast is enough to cover CodePipeline.
Right now, we are talking about forecasts and want to recognize potential savings by using CodePipeline in your environment. To do this, we will need to find out some information to calculate those savings. The first piece of data will be the average cost per hour for personnel who do your deployments. It is essential to calculate the actual employee load, not just the base salary. You will want to make sure that your hourly rate also includes vacation, benefits, and payroll overhead to get real representation. For the sake of this exercise, we will use $100 per hour as our employee rate. The next piece of information we need is how much time it takes to perform a deployment of your software. This number would be the amount of time that it takes an engineer to get the software, log on to the server, perform any backups, install the updates, and perform smoke testing and any other functional test. Let us use four hours per environment for our exercise. The last piece of information we need is how often updates are applied. Typically, updates are most frequent in development environments, less frequent in test environments, and significantly less frequent in the production environments. You want to find out how often you deploy for each of those environments to calculate accurately how much an automated deployment will save you. For this exercise, we will use one implementation for development per week, one deployment per month in test, and one deployment every three months for production. These numbers are a typical average that I see at most companies.
Let’s start doing some math. We will take the 4 times of 4 hours, for a total of 16 hours per month spent deploying the development environment. That is 2 days of effort per month in a year that is equal to 24 days, or more than an entire working month. The 24 days is just for the development environments. Next, we want to calculate just how much that costs. We said we’ll use $100 an hour, so let’s multiply 100 by 8 hours, bringing the daily total to $800. Now we multiply that $800 by the 24 days of effort for the year. That brings the total to $19,200. As you can see, this is a major expense for your company. Now that we have the development cost, we want to repeat the process for the test and production environments.
For the test environment, it will be one-fourth the cost of development, because it is deployed only once a month. Test will take four hours per month or one day every two months, which works out to be six days for the year. We multiply six days by $800 to get the total cost of the test at $4,800 per year.
Production is only being deployed once every quarter. Production will be two days per year or $1,600 in employee effort. You can see that this company is spending tens of thousands of dollars ($25,600) to deploy the application, so automating the deployment of applications can save your company a significant number of dollars. This cost represents just one application. Most companies deploy multiple applications or several pieces to a large application. This application sprawl leads to a significant number of wasted company resources and potentially multiple headcounts.
You want to repeat this operation for any application that you can deploy automatically and update your total savings in cell C7. You do not wish to do this for an application that currently requires a significant number of manual changes and configurations. These would need to be automated. That will take longer to set up, and it will extend your migration timeline, reducing any savings that you would have achieved.
The wonderful part of deploying CodePipeline automated deployment is that you can significantly increase your company’s agility. Your company probably is not rolling out as many updates to your product as you would like. It is not because the developers are not making changes. It is because the cost of deployment is substantial, and the risks that are involved with it counteract the benefits. Once you create your pipeline, you can significantly increase the number of production updates that you are doing and deliver value to your customers faster. It is not uncommon to hear companies that have adopted an agile and automated deployment process to push as many as 10 production updates per day. This velocity is a vast improvement for time to market over most companies that roll out updates only every quarter or longer. Development deployments could be done daily or multiple times per day. Testing and production could follow suit to reach multiple production updates per day. To obtain this level of agility, your company will have to invest in more than a simple deployment pipeline and increase the automated testing to ensure a quality release.
Service Catalog
AWS Service Catalog is a service that allows you to create products with CloudFormation templates, which deploy AWS infrastructure as code (IaC). CloudFormation enables you to automate the majority of your AWS infrastructure deployment. For example, look at the following code snippet:
InstanceSecurityGroup:
 Type: AWS::EC2::SecurityGroup
 Properties:
     GroupDescription: Allow http from the internet
     VpcId:
        Ref: myVPC
     SecurityGroupIngress:
     - IpProtocol: tcp
       FromPort: 80
       ToPort: 80
       CidrIp: 0.0.0.0/0
     SecurityGroupEgress:
     - IpProtocol: tcp
       FromPort: 80
       ToPort: 80
       CidrIp: 0.0.0.0/0
Your operations team can then allow access to these products by semitechnical staff to deploy the infrastructure required for their workloads. Service Catalog is an excellent way to save money postmigration to AWS. I have seen many companies significantly reduce the strain on their operations department by implementing Service Catalog.
In many companies, the operations team or cloud management team is a choke point and single point of failure in the deployment of infrastructure. By implementing Service Catalog, you allow your business units to deploy their infrastructure, thereby reducing the dependency on your operations team. This enablement removes the choke point, reduces delays, and overall increases the quality of service.
When you are planning to migrate to AWS, I recommend approaching Service Catalog by looking for repeating patterns in your current applications. The identification of these repeating patterns allows you to maximize the impact of Service Catalog. Your team can then translate those repeating patterns into infrastructure as code and a Service Catalog product. Once the products are complete and added to the catalog, access rights can be assigned to allow employees to deploy them.
Finding out how much you have saved by Service Catalog is different for every company. To help with assessing your savings, we will look at two scenarios. The following scenario focuses on the automated deployment of EC2 instances, and “Scenario 4-6” addresses S3 buckets with corporate hardening applied.
When reviewing your infrastructure for patterns, you will often ingest a lot of noise. If your company is like Bridget’s, it probably has many servers, applications, and design patterns. However, sometimes the answer is staring you right in the face, and you must clear the fodder to see it. I purposely added much extraneous information into this scenario to demonstrate this fact. We are looking for repeating patterns to optimize the impact of Service Catalog. It does not matter how many servers or apps Bridget has. You might have started going down the mental path of thinking about the infrastructure side: how servers, load balancers, auto scaling groups, and similar items were laid out. For your infrastructure, these might be viable options. In Bridget’s case, the fact that her company is regulated and it has to put three and a half hours of effort into deploying each system is a massive amount of energy.
If we use $100 an hour for her operations team for easy calculations, we see that it is costing the company $28,000 a month to deploy these servers,1 or $336,000 a year. Now I don’t know about you, but I don’t want that number in my budget, and I’m sure my staff would much rather do something more interesting.
To calculate how much Bridget will ultimately save, we also need to calculate the amount of time it will take for her team to create the Service Catalog product. Based on the description of her environment, I think it would be overly safe to say three weeks of effort to perform the work. This timeline would include creating the required CloudFormation and automation scripts and testing of the product once it was completed. Based on the cost per hour, it will cost Bridget’s company $12,000 to create the product.2 Next, we need to know how much it will cost to deploy the product. Let us say that it takes 10 minutes to log on to the AWS console, select the product, configure its options, and deploy. That means it would cost Bridget’s company $16,000 of employee effort to deploy the same servers over a one year period.3 Bridget’s company will save a total of $308,000 in year one by implementing this product.4 That is a significant return on investment and would be very worthwhile for the company to implement.
I would love to say that it is an absurd scenario that would never happen. However, this is one of those life is stranger than fiction situations. It is by no means odd to see a mundane technical task overloaded with administrative burden. Kurt wants to save the $354,600 that his company is currently spending on a mundane and low-value task. ServiceNow has a connector that Kurt’s company can leverage that would enable employees to deploy AWS infrastructure directly without logging on to AWS. Using the connector enables his company to leverage the existing workflow and approval capabilities of ServiceNow without the manual intervention of the cloud engineering team. Even if Kurt has to pay for consulting services to set up the connector to interface with the AWS Service Catalog, he still achieves a significant return on investment (ROI) in the first year.
Service Catalog can offer significant savings for your company, depending on your organization’s size. Obviously, if your company has only a few dozen people, the return on investment would probably not justify the cost of implementation. The service catalog also allows you to help maintain financial expenditures by only approving infrastructure sizes appropriate for your organization. Users will often also have an improved user experience. Service Catalog will enable them to see the products easily that they have already deployed, and when an update is published, they will be automatically notified.
Now that you see a couple of ways Service Catalog and pipelines can save significant amounts of money for your organization, it’s time to enter it in the forecast worksheet. These savings are designed to be entered in cell C7, Agility Savings. At this point in the process, your forecast should resemble Figure 4-9.
Assumptions
Now that we have covered everything in the forecast, it is important to discuss assumptions around technology, capabilities, and costs. Throughout this book, we have made numerous assumptions. We have talked about migration percentages and agility savings and approximation of the bandwidth charges, to name a few. In total, you probably made dozens of assumptions throughout the process. Unfortunately, human nature dictates that when you write something down, you set it in stone. Inevitably, someone will read that and expect it to be 100% accurate. That is why documenting your assumptions is critically important.
You might be wondering what assumptions you should document. It is not uncommon for me to record 30 assumptions, although I cull those items from a significantly more extensive list. Typically, I do not document obvious assumptions. For instance, I would not list that the migration timeline is an estimate; this is an undeniable truth because you do not have a crystal ball. What I would recommend documenting are things like the employee overhead per hour for the cloud engineering team that you used in an agility savings assessment. To assist you in generating your assumptions and getting the creative juices flowing, I have included a list of potential assumptions in Table 4-2. These assumptions cannot be used verbatim, but they should be usable with some minor tweaking and adjustment. It may also give you other ideas that are relevant to your environment.
The Excel workbook has a section named “Assumptions” for the documentation of your assumptions. This allows them to remain with the forecast and eliminates a significant number of questions. In my experience, it is best to document them with the forecast directly instead of as an addendum or additional document. This proximity allows easy flipping of back-and-forth between the assumptions and the forecast for easier analysis and ensures their visibility. With your assumptions documented, your forecast should now look like Figure 4-10.
Cost Burn-Up/Burn-Down
The burn-down rate and burn-up rate refer to the incremental decrease and increase of spending as you migrate your infrastructure. When you migrate servers to AWS, you burn up, as in adding more cost to your run rate in Amazon. The other half of the equation is the burn-down: as you migrate off, you recoup some costs on the on-premises equipment. However, these two rates are not equal. The burn-up rate is typically a linear path with a small amount of stepping as you migrate applications. An example of a burn-up can be seen in Figure 4-11.
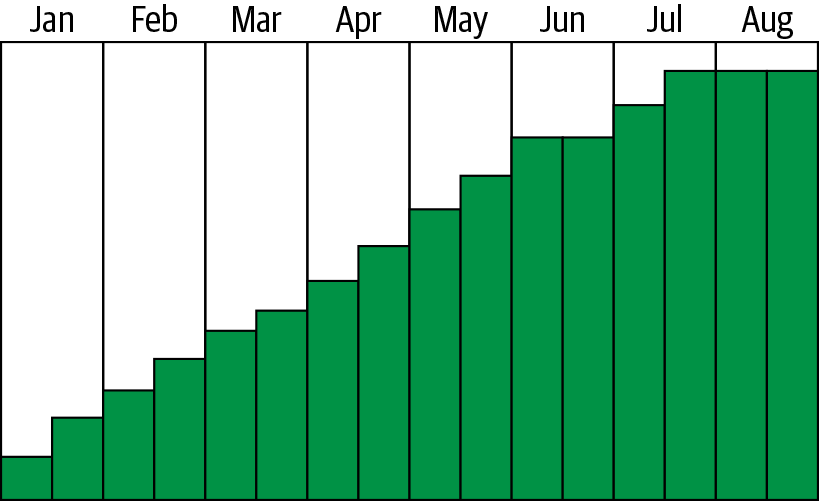
Figure 4-11. Burn-up example
Figure 4-11 shows a company migrating from on-premises to AWS. As you can see, the overall trend is quite linear but has steps as each of the significant migration waves are completed. Some of the waves had applications with more server counts, which is why some of the steps are larger than others. In Figure 4-12, you can see a burn-down graph, which is significantly different from the burn-up.
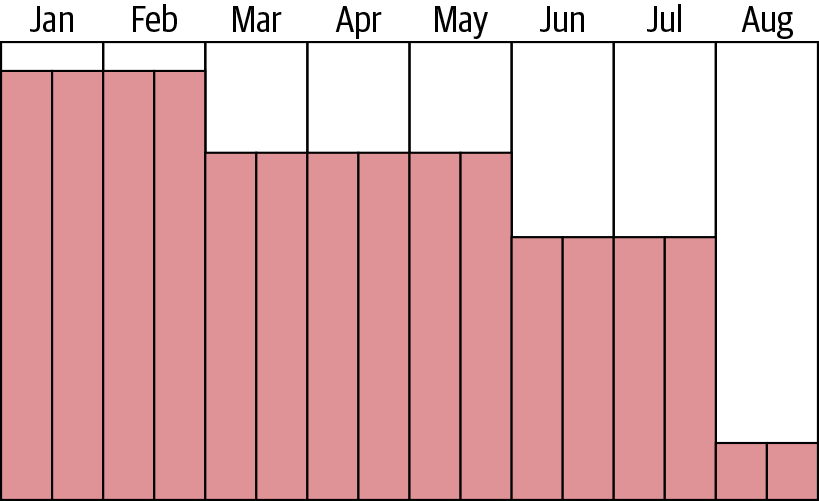
Figure 4-12. Burn-down example
When you are migrating from on-premises, the removal of a server does not necessarily indicate the removal of all the underlying infrastructure. This latent removal is not true for physical servers such as a large database server where the equipment is removed immediately. However, most companies have a highly virtualized infrastructure. In such an infrastructure, most components are shared among dozens to potentially hundreds of thousands of servers. In the typical case, you will have to remove many servers on-premises to see cost reduction. Therefore, the steps in Figure 4-12 are significantly longer in duration and shorter in decreased spend when compared to burn-up. Most of the cost reduction in the burn-down does not occur until the very end of the migration. This reduction is when the most significant components of the on-premises infrastructure can be shut down, such as SANs and the facilities themselves.
Typically, I do not include a burn-down analysis in the migrations that I have worked on, mostly because of the amount of effort that would be required to compute it. To calculate the burn-down, you need to know which servers are physical and virtual, and if the latter, what host and SAN they are attached to. It would be best if you then allocated the appropriate costs for those assets to those servers and where they are in the migration to create a burn-down. Burn-down calculations add several weeks to an overall migration timeline and yield a very low value to the business. Burn-down analysis also cannot occur until after the migration planning phase and is not included in the forecast. The reason I have included it in this chapter is that for many people, it makes sense to include burn-down as part of the financial forecast. At first glance, this does make sense, but once you understand what is required to complete a burn-down properly, you will see how it is impractical to include it in the forecast.
Wrapping It Up
In the grand scheme of things, building your business case is probably one of the smaller efforts in the migration process. Most of the information is already available from the previous processes, and it is more about adjusting and properly conveying the material that is important for the business case. Building the narrative is probably the lengthiest process. However, thankfully, you should have a good source of information from the FAQs that were built as part of Chapter 1.
The business case is a pivotal point in your migration to AWS; it’s the final piece that conveys your intent, costs, and business value. At this point, you will be at a crossroads; one path takes you forward to your migration, and the other leaves you on-premises. I cannot express enough how important the business case is in taking your company forward in its competitive capabilities by migrating. It deserves attention and should not be viewed as onerous. Hopefully, your business case shows the value you have uncovered, and your migration efforts are approved. To prepare you better to start migration, Chapter 5 will cover addressing your company’s operations in preparation for migration, and how to build a successful story that you can carry forward to other departments to gain adoption.
Get Migrating to AWS: A Manager's Guide now with the O’Reilly learning platform.
O’Reilly members experience books, live events, courses curated by job role, and more from O’Reilly and nearly 200 top publishers.

