Compound annual growth rates are the key to comparing the growth rates of different investments.
To consider the rate of growth of a value over time, you must determine its compound annual growth rate (CAGR), also known as the annualized growth rate, which gives you an idea of how the value changed over the years—not the actual year-to-year changes, but the growth rate as if the value had grown at a consistent rate each year. Whether you use a formula or a built-in Excel function to calculate CAGR, a spreadsheet makes the calculations easy.
Example 4-5 shows the formula for estimating CAGR when you have the values only for the beginning and ending periods in question.
Example 4-5. Formula for estimated CAGR
% CAGR = ((Ending Value / Initial Value) ^ ( 1 / # of periods) - 1) * 100
This formula isn’t much more complicated than the formula for percentage change, but it’s a snap to calculate in a spreadsheet. Here’s a walkthrough of the calculation:
- The caret symbol (^)
Raises the value to the left (
Ending Value/Initial Value) to the power or exponent on the right.- The exponent
Equals one divided by the number of periods that you’re evaluating.
Tip
Make sure to use the number of periods, not the number of years. For example, when you calculate CAGR based on five years of sales, you evaluate only four annual periods. The first year of sales provides the starting point. The remaining four years are the periods you evaluate for growth.
- Percentage calculation
Finally, subtract one to convert the results from an annualized growth factor to an annualized growth rate, and then multiply by 100 to display the result as a percentage. For example, when you have 150 percent of what you started with after one year, the annual growth factor is 150 percent, but the annual growth rate is 50 percent.
CAGR is handy for evaluating many measures on a company’s financial statements. If you’re looking at growth stocks, knowing how quickly those companies have been able to grow revenues, pre-tax profits, and earnings per share on an annual basis in the past can give you an idea of how well the company might perform in the future. A company with low growth in the past isn’t likely to suddenly surge in the next couple of years.
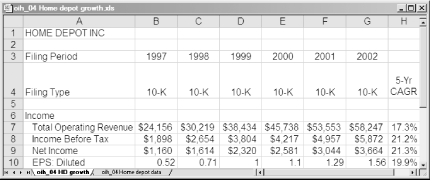
From EdgarScan (http://edgarscan.pwcglobal.com), you can download a spreadsheet of historical company data extracted from the company’s SEC filings. Eliminate the columns of quarterly data and calculate the compound annual growth rates for selected items, as illustrated by Home Depot growth calculations in Figure 4-1.
Figure 4-1. CAGR shows the annual growth rate required to increase the initial value to the ending value
The formula in cell H7 for five-year compound annual growth for total operating revenue looks like this:
=(F7/B7)^(1/5)-1
For Home Depot, operating revenues exceed $58 billion a year, so you can see that the company has produced very strong growth in revenues, net income before and after taxes, and earnings per share. Compared to the 7 to 10 percent you might expect for a large company, Home Depot is certainly performing quite well.
You can also
use the
LOGEST function
[Hack #35]
in Excel to calculate annual growth rates. This function applies the
least squares method, so that instead of calculating the growth rate
based only on the initial and ending values, it takes into account
all the values to provide an annual rate of growth that best fits the
historical trend.
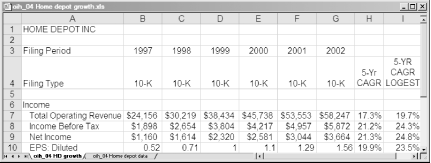
In Figure 4-2, the LOGEST
function is added to Column I in the compound annual growth rate
spreadsheet. The formula in cell I7 is shown in Example 4-6.
The formula is copied down the column, and the resulting value is formatted as a percentage to one decimal point.
Figure 4-2. The LOGEST function takes annual variations into account when calculating the compound annual growth rate
You can see the variations that come from the use of the
LOGEST function to calculate the compound growth
rate, such as 24.8 percent growth for net income using
LOGEST and 21.3 percent using the estimated
formula in Example 4-5. The
LOGEST approach is better in that it uses the
intermediate values to produce its result. Regardless which method
you choose, use it consistently for each stock you compare.
Consistency counts when considering historical growth, which is one element that’s not accounted for when calculating annual growth rates by either method. Consider two companies, one whose revenues and earnings fluctuate wildly from year to year and another whose performance is very consistent. The companies might have the same starting and ending values, and thus the same CAGRs—but the less consistent company might be less attractive because its unpredictability might indicate less skilled management or other risks.
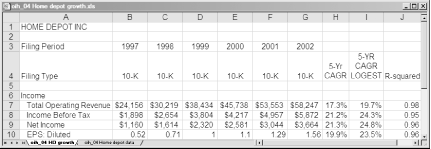
Fortunately, there’s a way to measure the consistency of a company’s past growth [Hack #35] . With a spreadsheet, you can calculate the R-Squared (or R2) value of past trends. This statistical measure indicates how closely the historical data would match a straight line if plotted on a chart.
For instance, a company whose earnings grew at exactly the same rate from year to year would have an R-Squared of 1.00. In the real world, this never happens, but many companies turn in stable growth year after year, which you can measure by the R-Squared value of their revenues or earnings. In Figure 4-3, Column J includes the R-Squared values for Home Depot’s historical data.
In Excel the LOGEST
function returns the R-Squared value for a set of numbers
in an array
[Hack #35]
.
The formula in Example 4-7 extracts R-squared from
the array. To obtain the array of results, you must enter the formula
as an array formula. To do this, type the formula in the Excel
formula bar and then press Ctrl-Shift-Enter to complete the entry.
Excel adds the braces around the formula to indicate that it is an
array formula.
In Home Depot’s case, the R-Squared results are between .95 or .98, which shows that the company’s performance has been remarkably consistent over the five years evaluated.
Tip
Some investors reject companies whose EPS R-Squared values are below 0.90 with the rationale that these companies have not been consistent enough to provide confidence in their future performance.
If you choose to display data in a chart [Hack #13] , you can add a trendline calculated by the least squares method and display the R-Squared value [Hack #35] .
You can find online CAGR calculators at the following sites:
MoneyChimp.com at http://www.moneychimp.com/calculator/discount_rate_calculator.htm
CPAdvantage.com at http://www.cpadvantage.com/onlinefinancialcalculators/cagrcalculation.aspx?LNC=_4_2 also calculates CAGR, but the user interface isn’t as simple as MoneyChimp’s
—Douglas Gerlach
Get Online Investing Hacks now with the O’Reilly learning platform.
O’Reilly members experience books, live events, courses curated by job role, and more from O’Reilly and nearly 200 top publishers.


