Calculate price and dividend ratios to help you figure out the current value of a stock.
Of all the ratios used in stock valuation, probably none is as popular as the price/earnings ratio (sometimes known as the P/E ratio or multiple). The P/E ratio compares the current price of a stock to the amount of money the company has earned. One interpretation of the P/E ratio is the measure of how much investors are willing to pay for each dollar of earnings the company generates. Not only does it help you judge whether a stock’s price is reasonable, it can indicate the confidence investors have in a company’s future. The more investors are willing to pay for a dollar of earnings, the higher their expectations for future performance. If investors won’t pay much for a dollar of earnings, they have little confidence in the company. The P/E ratio is calculated with the formula in Example 4-8.
You can use a P/E ratio in your stock analysis in a couple of ways. First, you can compare the P/E ratios of two or more similar stocks to determine which stock is a better value. You can also use the P/E ratio as a proxy for a stock’s value. You can’t directly compare the prices of stocks. Is a $32 share of Intel stock really more expensive than a $27 share of Microsoft? However, if you compare the P/E ratios of both companies, you can see whether you’d have to pay a premium for one or the other. For example, at $32 a share, Intel’s P/E ratio is about 45. Microsoft at $27 sports a P/E ratio of 29. Both stocks carry high P/E ratios, but in this example, Intel is quite a bit more expensive than Microsoft.
P/E ratios can vary greatly by industry (banks often trade at lower P/E ratios than other industries, for instance), size of company (a larger company might have a lower P/E ratio than a similar but smaller business because it’s easier for the smaller company to produce faster growth in the future), and reputation (popular, stable companies often command a premium P/E ratio in the marketplace).
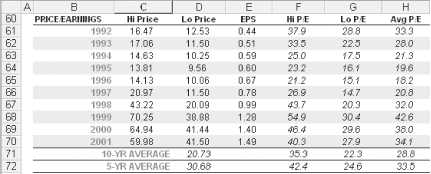
You can also use the P/E ratio of a stock to determine if the current price of a company is reasonable based on its history. By comparing the current P/E ratio to the stock’s average, average high, and average low P/E ratios of the past few years as demonstrated in Figure 4-4, you can see whether the stock is a bargain or overpriced. If the stock has sold usually at a P/E ratio of 35 in the past and now sells for a multiple of 28, it might be undervalued or the lower P/E ratio could be a red flag. P/E ratios drop for two reasons: either company earnings are growing faster than the stock price or investors are paying less for the stock for some reason. For example, they might be concerned about the effect of government regulations on future earnings. Do your research to determine why the P/E ratio has changed.
Column F in the Excel spreadsheet in Figure 4-4 calculates a company’s high P/E ratios for the last ten years by dividing a year’s high price (column C) by the company’s EPS (column E) for that year. For example, Example 4-9 shows the Excel formula for cell F61, the 1992 high P/E ratio.
Example 4-9. Excel function for calculating a high P/E ratio
High P/E Ratio (cell F61) = IF(E61<=0,"n/a",C61/E61)
The formula uses a conditional clause to ignore the calculation when the company has zero or negative EPS figures. When a company has no earnings or loses money, the resulting P/E ratio is meaningless and doesn’t offer any help in valuing the company. The low P/E ratios in column G are calculated in the same way.
Column H uses the annual high and low P/E ratios to determine an average annual P/E ratio, as shown in Example 4-10.
You can calculate average high and low P/E ratios for multiple years to spot longer-term trends, too. The spreadsheet in Figure 4-4 contains five- and ten-year averages. The ten-year average uses the function in Example 4-11.
You can quickly scan the columns to identify trends in a stock’s P/E ratios: are they stable, increasing, or declining? Investigate the causes of any changes. For example, is tough competition cutting into the company’s profit margins and resulting in lower earnings growth? Although lower earnings increase the P/E ratio if the price stays the same, you’ll rarely find the price unchanged for long when earnings growth slows or declines.
You can compare the current P/E ratio to the historical trends and averages [Hack #36] , and gain a better sense of whether the stock is over- or undervalued at its current price. For example, when the current P/E ratio is higher than the average as shown in Figure 4-4, you’re paying a premium for the stock. You must be particularly careful when P/E ratios trend down. That’s often a sign that the price is dropping, and you don’t want to buy as the price continues to fall.
The true measure of a publicly traded company’s success will always be the profits it earns through the years. By reinvesting these profits back into its business, a company funds further expansion without the need to borrow money or sell additional shares to the public. For mature companies, however, there can come a time when management simply can’t find enough uses for all of the money it earns each year. A company might then decide to start paying out a portion of these profits to investors as dividends.
A regular stream of dividend payments is important to investors who depend on their portfolios to deliver current income on which they can live. That’s why stocks that pay high dividends are sometimes known as income stocks. For other investors, a dividend contributes to the overall return they receive from their investment and adds some security to the investment as well.
Analyzing the dividends that are paid by two different companies isn’t as easy as figuring out how much each will pay to investors in a year. You need the market value of each stock to determine the dividend yield. The dividend yield is useful when comparing two or more stocks, but you can also use it to compare an investment to what you might earn in interest in a bank account or to the yield on a bond. Example 4-12 shows the formula for the yield represented by dividends paid.
Example 4-12. Formula for the yield represented by dividends paid
% Dividend Yield = ($ Annual Dividend Paid / $ Market Value per share) * 100
A stock’s yield is usually calculated using its indicated dividend, the total that would be paid per share over the next 12 months if each dividend were the same as the most recent dividend.
Since dividends are, by definition, a portion of a company’s profits that are paid to its shareholders, what happens to the dividend when a company earns fewer profits or even begins to lose money? Eventually, the company will have to stop paying dividends—a decision that is not popular with investors who might be counting on those regular cash payments. On the other hand, a company might pay too much of its income as dividends, leaving it with inadequate working capital to expand its business, pay down debt, or invest in other ways that might greatly benefit the company.
One way to examine a company’s dividend policy is to calculate its payout ratio. The payout ratio is the amount of the company’s annual earnings that is paid out as dividends to its investors. You can calculate it with the formula in Example 4-13.
Most companies are quite concerned with protecting their dividends, because canceling or reducing dividend payments is never well received by shareholders. In addition, shareholders often pressure companies to increase their dividends on a regular basis. Many companies take pride in the number of years that they have regularly paid dividends to shareholders, as well as how often they have been able to increase those payments. Investors tend to interpret this historical record as a sign that a company is stable and safe.
The payout ratio can help you understand just how safe a company’s dividend might be. High payout ratios are double-edged swords. For investors seeking current income, a consistently high payout ratio means more money to live on. In addition, a long history of paying steadily increasing dividends is often a sign of quality management and dependable performance. However, a company with a high payout ratio doesn’t retain much of its earnings to grow its business, so the dividend might represent most, if not all, of the return you earn. Therefore, for younger investors who want to grow their portfolios, a high payout ratio might not be beneficial. High payout ratios can also lead to financial problems, if the company doesn’t retain enough of its earnings to operate effectively.
High payout ratios are fine in industries that don’t require a lot of additional capital. However, companies like Intel, which spends billions of dollars to build just one new plant, or Pfizer, which spends over $5 billion a year in research and development, require plenty of money to grow their businesses, and paying out a lot of dividends is detrimental.
Tip
Because different industries have different capital requirements, it’s a good idea to compare the payout ratio of a company to the industry average. If a company payout ratio is below average, investigate further to see if that is an indication of problems or that the company has investment plans. For high payout ratios, check financial strength ratios very carefully to make sure the company can afford to pay out that much of its earnings.
Dividend payout ratios can increase when company earnings fall. If you see the payout ratio increasing from year to year as earnings decrease, don’t be surprised if the company slashes its dividends. If the payout ratio is over 100 percent, annual net income isn’t enough to cover the total cost of dividends in that year. In that situation, companies must come up with the cash in some other way, such as borrowing from the bank or tapping into their own reserves. A company might do this to maintain its dividend payment record during a short dry spell, but over time, of course, a company simply can’t continue to pay dividends if the cost exceeds what it earns in a year.
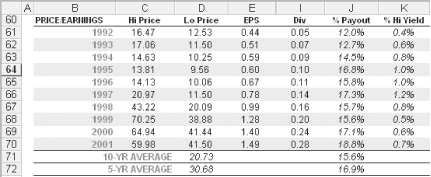
The Excel spreadsheet in Figure 4-5 continues the price and dividend ratio study by calculating the payout ratio and yield. To calculate the payout ratio, use the following formula in cell J61:
=IF(E61<=0,"n/a",I61/E61)
The IF clause makes sure that the EPS are
positive. If a company is losing money, its dividends might be
reduced down the road. You should do more homework to evaluate the
cause and scope of the company’s problems.
If you examine the company’s annual payout ratio over several years, you can spot negative trends, such as increasing payout ratios from decreasing earnings that could forebode a coming crisis in the company’s operations. You can also calculate an average payout ratio over five years to estimate how much a company might pay in dividends in the future.
Because there are several flavors of earnings per share [Hack #15] (such as excluding extraordinary items, as reported, and normalized), make sure you know what kind of EPS figures are used to calculate a P/E ratio, particularly when comparing several companies.
The P/E ratio is calculated using earnings from the last four reported quarters. These trailing earnings are indicated with TTM, which stands for trailing twelve months. Some data providers calculate P/E ratios using EPS from the last two reported quarters plus the projections for the next two quarters. The projected P/E ratio uses estimated EPS for the next four quarters. The projected P/E ratio is helpful when you evaluate companies with very high EPS growth rates, because current P/E ratios for fast-growing companies are almost always high. The projected P/E ratio compares the current price, which typically incorporates expectations of future earnings, with those future earnings.
After you’ve determined the annual P/E ratio for the last five or ten years, you can refine your analysis with one additional calculation. Relative value (RV) is the ratio of what investors are paying today for a stock compared to what they have paid on average in the past. Relative value is calculated with the formula in Example 4-14.
Example 4-14. Formula for relative value
% Relative Value = (Current P/E Ratio / Average P/E Ratio) * 100
Relative value is expressed as a percentage. Generally, a stock with a relative value less than 100 percent is undervalued; if RV is much greater than 100 percent, a stock is probably overvalued. Most long-term investors consider a relative value between 90 percent and 110 percent as an indication of fair value. If RV is much less than 70 percent, the company might be going through a tough patch, and investors have bid down the share price because of their reduced expectations. In this case, the very low RV is a signal of trouble, not of a bargain price. However, by 2002 and 2003, many good companies carried RVs below 70 percent, because investors were being careful on account of the ongoing bear market.
Conversely, when RV is above 150 percent, investors are paying a significant premium for a stock. This can indicate that the stock has reached a price peak, and the only direction it can go from there is down. For companies with below-average growth rates, selling might be in order. However, for higher-growth companies, an RV of 150 is quite common.
One last wrinkle: you can also calculate projected relative value by substituting the projected P/E ratio for the current P/E in the relative value calculation in Example 4-14. This can be useful in comparing several stocks when analysts and investors see weakness in the next year for a particular company or industry.
With P/E ratios and dividend ratios, the more you compare, the better you can evaluate the current value of stock price. Comparing the current P/E ratio to historical values, P/E ratios of other companies, or average P/E ratios for the industry can indicate whether a stock is overpriced. Comparing dividend yields and payout ratios to those of other companies or the industry average can help you determine whether the ratios are signs of safety or trouble. You can compare ratios and view historical trends on several web sites. Each one has its own benefits, so you might choose to use one or all in your stock studies.
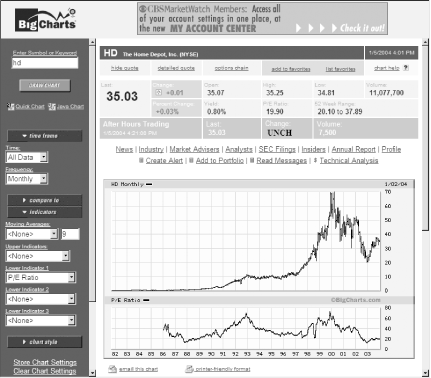
With BigCharts (http://bigcharts.marketwatch.com), you can create charts that show historical prices, P/E ratios, dividends, and yields, as shown in Figure 4-6. For example, Home Depot’s P/E ratio has cycled from values below 20 to as high as 75 twice in the past 25 years.
Figure 4-6. Using BigChart’s interactive charting, you can see the historical variation in Home Depot’s P/E ratio
Type a ticker symbol in the Symbol box at the top of the page and click Interactive Charting.
In the Time drop-down list, choose All Data.
In the Frequency drop-down list, choose Monthly.
Click the Indicators button.
In the Lower Indicators boxes, choose one of the following measures:
- P/E Ratio
Displays the P/E ratio calculated using the rolling 52-week EPS
- P/E Ranges
Shows high and low P/E ratios for the period you choose in the Frequency list
- Rolling Dividends
Displays the rolling 52-week dividend as dollars per share
- Yield
Shows yield calculated by dividing the 52-week rolling dividend by the stock closing price and multiplying by 100
Click the Draw Chart button.
At Morningstar (http://www.morningstar.com), you can compare current and ten years of historical P/E ratios as well as three other stock valuation ratios: price/book, price/sales, and price/cash flow. The table also includes the valuation ratios for the S&P 500 index. Type a ticker symbol in the Ticker box on the Morningstar home page and then select the Valuation Ratios tab on the stock page. To see ten years of ratios, select the 10-Yr Valuation tab above the table. Select the Yields tab to see a graph of the earnings and dividend yield for the stock compared to other yields, such as the 30-year T-bond yield.
Quicken.com (http://www.quicken.com) provides an easy way to compare all sorts of financial measures and ratios to the competition.
On the Quicken.com home page, type a ticker symbol in the Enter Symbol box and click Go.
On the stock page, click Compare to Industry. You can check the checkboxes for the competitors you want to evaluate or type additional ticker symbols (separated by commas) in the “Enter tickers of the companies you want to compare” box. The table of competitors includes the market capitalization for each company, so you can choose competitors of similar size.
Tip
To add an index to the comparison, find its ticker symbol by clicking
the “Don’t know the
symbol” link. Select the Index option, type
Index in the Name box, and then click Search.
You can cut one of the symbols from the Quicken Ticker Search window
and paste it in the box on the “Compare to
industries” page.
Under the Choose Information to Display heading, select the Fundamentals option. Click Compare. For each category of measures, Quicken.com displays a row for each company and index you chose with several measures in each row.
—Douglas Gerlach
Get Online Investing Hacks now with the O’Reilly learning platform.
O’Reilly members experience books, live events, courses curated by job role, and more from O’Reilly and nearly 200 top publishers.


