Chapter 20. Case Study: MAPLight.org
In 2005, California legislators passed California Fresh Start, an $18 million pilot program intended to help schools pay for fresh fruit in students’ breakfasts. But there was a voice of opposition: the food processing industry, which makes money from the sale of processed fruit, not fresh fruit. Between 2001 and 2006, the food processing and sales industry contributed $2.3 million to 189 different candidates.[165]
Acting at the behest of the food processing industry, a Central Valley lawmaker deleted the word fresh from the proposed program in 12 places, replacing it with the word nutritious.[166]
The bill was signed into law. Schools used millions of dollars, originally intended for fresh fruit, to serve canned fruit in sugar syrup.
In 2003, Assembly Bill 83 (A.B. 83) was introduced in the California legislature. Had it passed, this bill would have imposed the same safety standards on bottled water as those applied to public water systems. A broad array of consumer and environmental groups ranging from Physicians for Social Responsibility to the state attorney general came out in favor of its passage.
After flying through the Assembly, A.B. 83 was killed in the Senate Appropriations Committee by a single vote. It never became law.
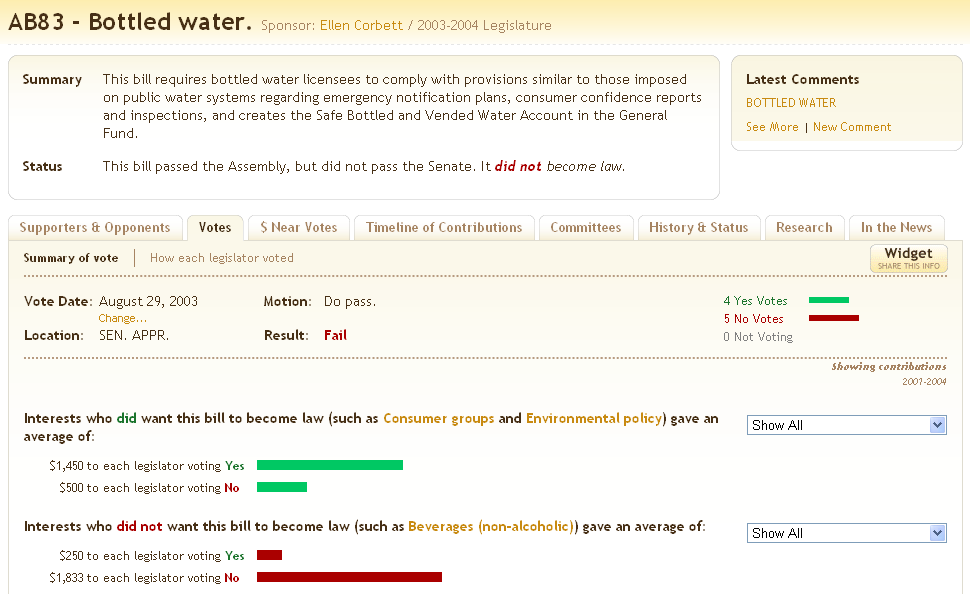
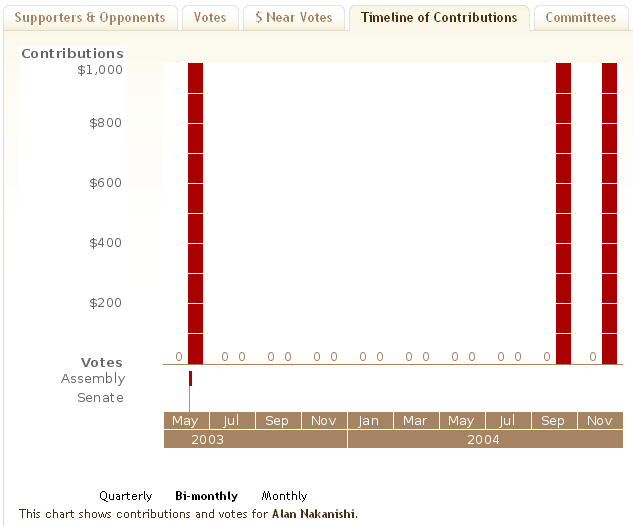
The beverage industry, which opposed A.B. 83, gave an average of $1,833 to each of the five Senate Appropriations Committee members who voted “no” on the bill—more than seven times as much money as they gave to the four committee members who voted for its passage. In an earlier vote in the Assembly, Assemblyman Alan Nakanishi accepted $1,000 from the California/Nevada Soft Drink Association and voted against the bill the very next day.[167]
Why We Founded MAPLight.org
Our politicians make decisions about the water we drink and the sugar syrup our children eat with a bias toward the bottled water firms and fruit-canning firms that hand them campaign cash. After all, elected officials must collect vast sums of money to run their campaigns, and the best sources of that money are companies and organizations with a vested interest in how these officials vote.[168] Our system is designed with corrupting influence built-in.
Profit-driven companies wouldn’t be making campaign contributions if doing so didn’t buy them influence or access. In many cases—such as California Fresh Start and the bottled water bill—targeted campaign contributions now can generate a sky-high return on investment down the road in the form of favorable laws and looser regulations. Although money doesn’t carry the day on every bill or in every vote, in the aggregate it is striking how strongly the money tends to correlate with the votes on issue after issue.
Why, then, isn’t there the same kind of public anger and organized advocacy around campaign contributions as there is around health care, education, the environment, taxes, and the host of other issues that ignite public controversy and activism? In a 2000 Gallup poll asking a national sample of Americans to rank the relative importance of 25 different policy issues, campaign finance came in second to last.[169]
It certainly isn’t because people lack a broad understanding of the money–politics connection—ask around and you’ll notice a widespread cynicism about the cozy relationship between politicians and special interests. Rare is the idealist who believes that the river of money flowing through Congress leaves politicians utterly untainted.
Perhaps it is because, cynicism aside, the tangible consequences of this system remain largely invisible. People care more about bottled water and fresh fruit than they do about the abstract issue of money and politics, even though the river of money that underlies our politics critically affects what we eat and drink.
I came to politics as a volunteer and observer. As a political volunteer, I was frustrated with the uphill battle that issue-oriented nonprofits and community groups fight against big-money special interests. I saw that activists trying to change the system have the deck stacked against them. When I tried to explain these money-influence connections to others who did not yet see them, however, my examples were not good enough. It took too much hand waving to explain to people what money and politics had to do with the issues they cared about. The complex relationships between legislators, their donors, and the votes that resulted were too complicated to explain using the tools available. So, I and other like-minded folks decided to build a new tool: a website that would show the specifics. And thus MAPLight.org was born.
We created MAPLight.org to make these money-issue connections transparent—to connect the abstract topic of campaign money to the specific issues that affect people’s lives. The “MAP” in “MAPLight.org” stands for Money And Politics. MAPLight.org is a groundbreaking public database that illuminates the connection between money and politics in unprecedented ways.
The MAPLight.org website allows citizens and journalists to answer questions such as:
How did a legislator vote on a particular bill, and who are the top contributors to that legislator?
When did legislators vote to support bills their top contributors supported?
When did special interests (such as insurance companies or drug companies) succeed in blocking bills that did not serve their interests?
We give citizens the tools to find out for themselves how campaign contributions affect the issues they care about. We make the abstract connection between campaign donations and legislative votes visible and concrete. Connections that once would have taken days or weeks to uncover are now available at the click of a mouse. In the past year and a half alone, we have reached more than 12 million people with our groundbreaking money and politics data—on our website and through news stories on television and radio and in newspapers and blogs. By making money–vote correlations transparent, easily researched, and publicly accessible, we finally stand a chance at holding legislators accountable.
MAPLight.org’s Unique Contribution
MAPLight.org is a Web 2.0 transparency mashup that puts together three data sets that have never before been combined: campaign money, votes, and special interest positions on bills. We combine campaign contribution data from the Center for Responsive Politics (OpenSecrets.org; see Chapter 21) and the National Institute on Money in State Politics (FollowTheMoney.org; see Chapter 19); legislative voting records and bill information from GovTrack.us (see Chapter 18); and special interest support and opposition data gathered by MAPLight.org’s in-house research team.
For each bill, our research team uses public-record sources such as congressional hearing testimony and news databases to determine:
- Organizations in support or opposition
For example, ExxonMobil or American Bankers Association
- Industries in support or opposition
Industry categories, such as multinational oil companies or commercial banks
For example, we found that the Credit Cardholders’ Bill of Rights of 2009 was supported and opposed by the organizations and industries listed in Table 20-1.
Organizations that support | Organizations that oppose |
Americans for Fairness in Lending | Association of Community Organizations for Reform Now |
Center for Responsible Lending | Consumer Action |
Consumer Federation of America | Consumers Union |
Demos | National Association of Consumer Advocates |
National Consumer Law Center | National Small Business Association |
National Training and Information Center | Public Citizen |
U.S. Public Interest Research Groups | American Bankers Association |
Credit Union National Association | Independent Community Bankers of America |
Industries that support | Industries that oppose |
Small business associations | Consumer groups |
Commercial banks and bank holding companies | Credit unions |
Our research team has gathered support/opposition data for more than 3,000 bills to date.
By itself, our support and opposition information gives immediate insight into what is really at stake for bills in Congress, quickly orienting readers to the interest groups behind legislation. It is often difficult to understand the true intent and beneficiaries of congressional legislation. MAPLight.org’s unique data provides valuable signposts, showing who is on which side.
Even more significantly, our data provides the “glue” to connect political inputs (such as campaign contributions and lobbying) to political outputs (such as contracts and legislation). A vital part of making the transparency movement useful to ordinary people is connecting government information with the specific issues that people care about. MAPLight.org’s data links campaign dollars to relevant issues with everyday impact—prescription drugs, gas prices, credit cards, and more.
Nuts and Bolts: Using MAPLight.org
With campaign contributions, politicians’ votes, and interest group positions all loaded into our website, MAPLight.org’s “transparency tools” allow users to go in and find data by bill, legislator, or interest group. The data can then be “sliced and diced” in myriad ways to drill down to specifics.
Votes
For example, if you were to search our site for A.B. 83, the bottled water bill, you could see the imbalance in campaign donations by opposing/supporting interests and to legislators voting yes/no (see Figure 20-1).
Overviews such as this reveal the big picture—the broad correlations between money and votes.
Timeline
MAPLight.org’s timeline feature allows users to see both overall and individual legislators’ contributions over time, with dates of votes marked. For A.B. 83, the bottled water bill, Alan Nakanishi’s timeline looks like Figure 20-2.
Nakanishi voted “no” on this bill on June 4, one day after he accepted $1,000 from the bottled water trade association.
Committees
MAPLight.org’s committee tool allows users to drill deeper, uncovering the money behind a bill even before a vote has occurred.
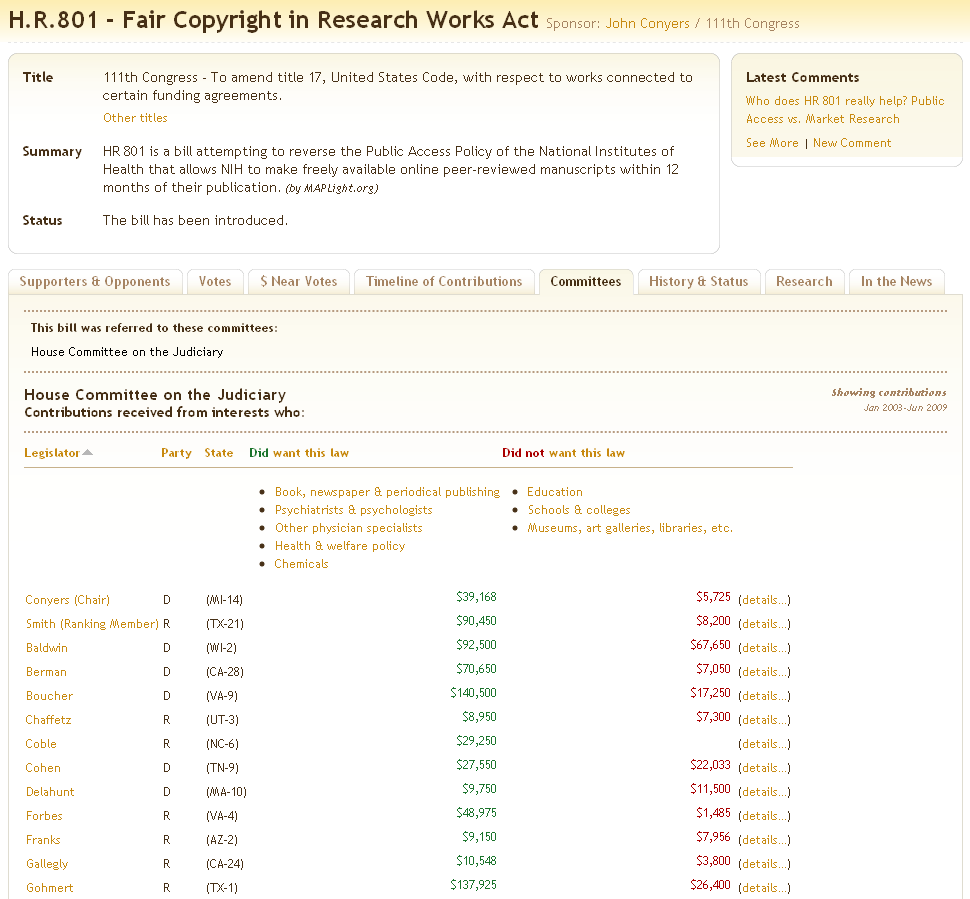
For example, in 2009, Representative John Conyers, D-Mich., introduced H.R. 801, the Fair Copyright in Research Works Act. The bill would reverse the National Institutes of Health’s Public Access Policy and limit public access to peer-reviewed journal articles produced by scientists receiving taxpayer funding for their research.
Figure 20-3 shows the MAPLight.org committee data on H.R. 801, showing campaign dollars given to each House Judiciary Committee member by publishers and other interests who supported and opposed this bill.
On March 2, 2009, law professor (and MAPLight.org board member) Lawrence Lessig published an article on the Huffington Post website regarding this copyright-related bill.[170] The article criticized Conyers’ role as the bill’s sponsor, claiming his position on the issue was influenced by the publishing industry, and cited MAPLight.org’s figures on publishing-industry contributions to Conyers and other bill sponsors.
The article set off a wave of critical blog posts and phone calls to Conyers’ office. Conyers posted a response on the Huffington Post website defending his position, and readers added more than 100 comments, most of them taking issue with his position. By March 15, the story had generated more than 100 blog posts that cited MAPLight.org’s report. Likely as a result of this public outcry, the bill has stalled and seems unlikely to make it out of committee.
This public outcry was spurred in part by people’s ability to learn about the campaign money behind the bill in time to influence the legislative outcome. In this case, our money/votes data was used to bring public attention to an issue early in the legislative process, before a final vote, when public opinion could still sway the result. Instead of money-influenced results being presented as an entrenched fact of life, inviting cynicism, MAPLight.org’s new, quick-response tools allowed this money–politics connection to be presented as an actionable incident—and it got results.
How Each Legislator Voted
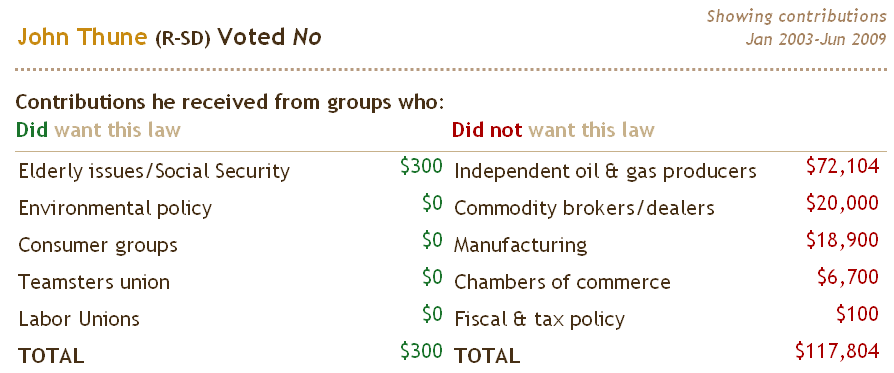
MAPLight.org also allows visitors to see the detailed contribution and vote data for individual legislators. For example, S. 3044, the Consumer-First Energy Act of 2008, was supported by consumer groups, among others, and was opposed by industries including independent oil and gas producers.
If a constituent of a particular legislator wants to see exactly how much money that legislator received, and from whom, he can see the contributions broken down by category on MAPLight.org’s site. For example, Senator John Thune voted “no” on this energy bill. Figure 20-4 shows his contributions from industries supporting and opposing the bill.
Other Tools
Other tools at the MAPLight.org site allow users to explore money–politics connections through other views—who a particular legislator’s main funders are, or who the biggest recipients of a particular industry’s contributions are. Data can be screened by state or by political party.
Our customization tools even allow users to combine our tools with their own outside knowledge. For example, if you happen to know about a group that supports or opposes a bill that isn’t listed in our database, you can customize your data view to incorporate that knowledge. That data won’t be added to our database until it’s verified by our researchers, but in the meantime you can analyze the data based on the knowledge you bring.
MAPLight.org’s data currently covers the U.S. Congress, the California State Legislature, and Los Angeles elected officials, with more states and cities to come. We aim to create transparency sites tracking money and politics in all 50 state legislatures.
The MAPLight.org organization, based in Berkeley, California, is lean and efficient. We use open source software to keep our costs low and our software development flexible, and we’ve created the technological infrastructure to build sites for all 50 states using the same software platform and visualization tools. Our financial support comes from foundations and individuals who see that a small investment in transparency yields big returns in accountability and reform.
Barriers to Transparency
It is an extraordinarily exciting time for the transparency movement. Advances in information technology have created the potential for citizens to hold legislators accountable with an immediacy that has never before been available. Yet the burgeoning transparency movement is fighting against government resistance every step of the way.
In California, for example, the state refused public access to its extensive database of how state lawmakers vote, instead opting to publish voting records one cumbersome page at a time. With our partner, the First Amendment Coalition, we sued the state of California and won public access to this database, which we will combine with campaign contributions to illuminate money’s effect on politicians’ votes in California.
It shouldn’t take a lawsuit for the government to realize its data belongs to the people. In this new era of open government and transparency, we hope our legal settlement serves as an example to city and state governments across the country to provide public access to public information.
In the U.S. Senate, senators (as of this writing) prepare their campaign contribution records on computers but then print them out and file them on thousands of pages of paper, which the government then keys in to a computer in a slow, error-prone, expensive process that obscures who contributes to Senate campaigns until after an election. House members and U.S. presidential candidates must file electronically. It takes public organizing and outcry to get senators, states, and towns to open up and share the key information citizens need.
Conclusion
Transparency is of great value in informing citizens and helping them hold legislators accountable. But transparency isn’t enough. Citizens shouldn’t have to play watchdog for their legislators. We might hope that with more transparent data we might curb the most blatant problems, but we still have a corrupted system.
MAPLight.org’s research department reveals how contributions correlate with legislation so that citizens have key information needed to draw their own conclusions about how campaign contributions affect policy. The correlations we highlight between industry and union giving and legislative outcomes do not show that one caused the other, and we do not make this claim. We do make the claim, however, that campaign contributions bias our legislative system.
In the worst case scenario, special interests buy votes. In the best case scenario, candidates who are favorable to industry interests have more money to run and win office, while candidates who take positions contrary to industry interests are unlikely to receive industry funds and thus have fewer resources for their election campaigns. Either way, Congress as a whole (and state legislatures) is biased in favor of special interests, even if no legislators change their views or votes. Campaign donations are not the only factor that influences how lawmakers vote, but with politicians continually dependent on corrupting dollars from industries seeking special access, our country will never get the solutions we need.
To solve the problems our country faces, transparency alone is not enough. Citizens need to take action. Groups such as Public Campaign, Change Congress, and many others are seeking to change our corrupt system of money-dominated politics. Transparency by itself won’t solve the problem, but it can highlight the problem. With the transparency work of MAPLight.org, citizens now know where to focus their efforts for change.
About the Author
Daniel Newman is cofounder and executive director of MAPLight.org, a nonpartisan nonprofit illuminating the connection between money and politics in unprecedented ways. An entrepreneur and political organizer, Dan is the author of three books on speech recognition software and is the founder of Say I Can, a speech recognition firm. Dan cofounded the Berkeley Fair Elections Coalition and has served as a consultant to various political and nonprofit groups, including the Center for Voting and Democracy, the Israel Venture Network, and the Mental Health Association of San Francisco. He received an M.A. in psychology from the University of California at Berkeley, where he attended on a National Science Foundation Fellowship, and a B.A. in biomedical ethics from Brown University. He lives in Berkeley, California.
[166] San Francisco Chronicle, September 16, 2005 and March 7, 2006.
[167] Contributions from 2001 to 2004: http://maplight.org/map/ca/bill/5577/default/votes/vote-58113. Nakanishi: http://maplight.org/map/ca/bill/5577/default/timeline/93.
[168] For the 2008 election, the average winning U.S. House candidate spent $1,372,539. That requires raising $1,880 every day—including weekends and holidays—for an entire two-year term. The average winning Senate candidate in 2008 spent $8,531,267. That’s $3,896 raised every day—for six years. Source: Center for Responsive Politics.
[169] A User’s Guide to Campaign Finance Reform, Gerald C. Lubenow, Rowman & Littlefield Publishers, 2001.
Get Open Government now with the O’Reilly learning platform.
O’Reilly members experience books, live events, courses curated by job role, and more from O’Reilly and nearly 200 top publishers.


