Chapter 5. Formatting Charts
Microsoft Graph offers an abundance of ways to format your charts. You can reposition the legend, add and remove gridlines, change the color of the data series, change the upper and lower limits on the value axis, and more. Figure 5.1 shows a chart with Graph's default settings, and Figure 5.2 shows the same chart after formatting.
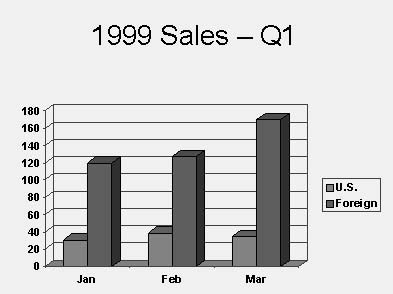
Figure 5.1. This 3-D column chart uses Graph's default settings.
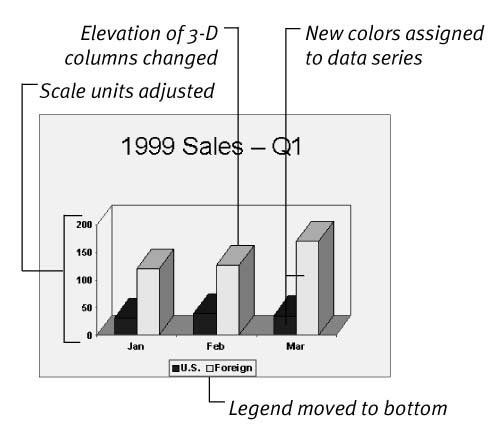
Figure 5.2. The same 3-D column chart after formatting.
See Chart Terminology in Chapter 4.
Formatting Charts
No matter what type ...
Get PowerPoint 2000/98: Visual QuickStart Guide now with the O’Reilly learning platform.
O’Reilly members experience books, live events, courses curated by job role, and more from O’Reilly and nearly 200 top publishers.

