January 2008
Intermediate to advanced
575 pages
16h 10m
English
Because each process is preventing the other process from getting a required resource, a deadlock occurs when two SQL Server system process IDs (SPIDs) are waiting for a resource and neither process can proceed.
SQL Server has a lock manager thread that checks for deadlocks. When a deadlock is detected, in order to break the deadlock, the lock manager will choose one of the SPIDs as a victim. The lock manager then cancels the current batch for the victim, rolls back its transaction, and issues an error message as in the following example:
Transaction (Process ID 53) was deadlocked on lock resources with another
process and has been chosen as the deadlock victim. Rerun the transaction.
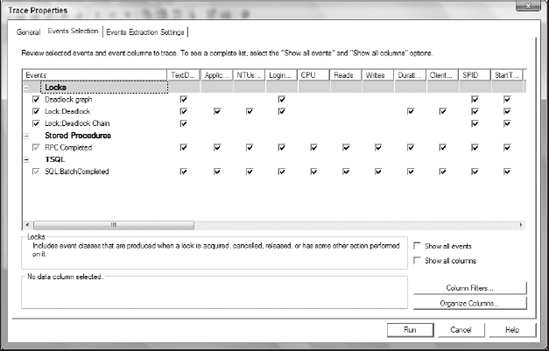
If deadlocks happen frequently, database applications suffer. SQL Server Profiler can create a trace to capture deadlock events for analysis. Use the following event classes to configure a Profiler trace (also, see Figure 5-11):
Lock:Deadlock Chain: Monitors when deadlock conditions occur.
Lock:Deadlock: Identifies which SPID was chosen as the deadlock victim.
Deadlock Graph: Provides an XML description of a deadlock. This class occurs simultaneously with the Lock:Deadlock event class.
RPC:Completed: Indicates that a remote procedure call has been completed.
SQL:BatchCompleted: Indicates that the Transact-SQL batch has completed.
To simulate a ...
Read now
Unlock full access


 O’Reilly covers everything we've got, with content to help us build a world-class technology community, upgrade the capabilities and competencies of our teams, and improve overall team performance as well as their engagement.I wanted to learn C and C++, but it didn't click for me until I picked up an O'Reilly book. When I went on the O’Reilly platform, I was astonished to find all the books there, plus live events and sandboxes so you could play around with the technology.I’ve been on the O’Reilly platform for more than eight years. I use a couple of learning platforms, but I'm on O'Reilly more than anybody else. When you're there, you start learning. I'm never disappointed.I'm always learning. So when I got on to O'Reilly, I was like a kid in a candy store. There are playlists. There are answers. There's on-demand training. It's worth its weight in gold, in terms of what it allows me to do.