January 2008
Intermediate to advanced
575 pages
16h 10m
English
One of the new SQL trace events worth mentioning is the Showplan XML event class. In the case of tuning T-SQL statements or stored procedures, the output of XML data with execution statistics is very useful.
To configure the Profiler, use the new event class Showplan XML, which includes the following events settings:
Showplan XML: Occurs when Microsoft SQL Server executes a SQL statement. Include the Showplan XML event class to identify the Showplan operators. This event class is under the Performance event category (see Figure 5-8). The XML Showplan output can be stored as a separated file as indicated in Figure 5-9.
RPC:Completed: Indicates that a remote procedure call has been completed.
SQL:BatchCompleted: Indicates that the Transact-SQL batch has completed.
When the Showplan XML event class is included in a trace, the amount of overhead will significantly slow down performance. To minimize the overhead incurred, limit use of this event class to trace specific problems for brief periods.
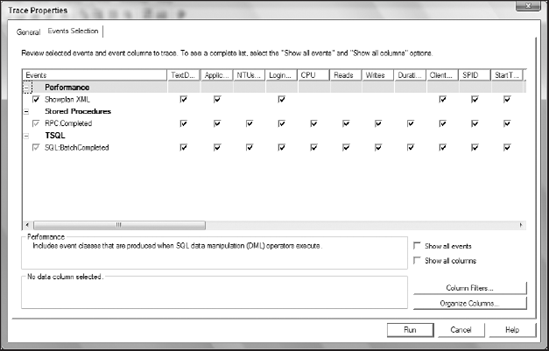
Figure 5-10 displays data from an Adventureworks database view called HumanResources.vEmployee. Profiler captured the query plan used. The actual plan used for the query and statistic data reveals valuable information for a query tuning (see Figure 5-10).
Read now
Unlock full access


