October 2019
Beginner to intermediate
498 pages
14h 13m
English
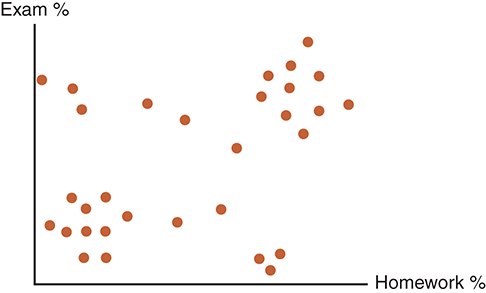
As a simple example of what can be learned through cluster analysis, consider the data shown in FIGURE 7.1. This data represents the performance of a class of mathematics students. The x-axis gives the homework total for the semester as a percentage of total points available; the y-axis shows the performance on exams, again as a percentage of total points.
Read now
Unlock full access


